 |
The Physical Manifestations of Glaucoma and What They Signify
Understanding the range of structural findings associated with this condition is key to effective management.
By Henrietta Wang, BOptom, MPH, and Jack Phu, OD, PhD
Jointly provided by the Postgraduate Institute for Medicine (PIM) and the Review Education Group
Release Date: January 15, 2024
Expiration Date: January 15, 2027
Estimated Time to Complete Activity: two hours
Target Audience: This activity is intended for optometrists who want to learn more about and examine the structural findings of glaucoma.
Educational Objectives: After completing this activity, participants should be better able to:
Recognize the pathophysiology of structural glaucomatous features.
Identify the physical manifestations of glaucoma.
Perform an ocular exam in a glaucoma patient or suspect.
Make clinical decisions related to the diagnosis and treatment of glaucoma.
Disclosure of Conflicts of Interest: PIM requires faculty, planners and others in control of educational content to disclose all their financial relationships with ineligible companies. All identified conflicts of interest are thoroughly vetted and mitigated according to PIM policy. PIM is committed to providing its learners with high-quality, accredited CE activities and related materials that promote improvements or quality in health care and not a specific proprietary business interest of an ineligible company.
Those involved reported the following relevant financial relationships with ineligible entities related to the educational content of this CE activity: Faculty - Dr. Wang and Dr. Phu have nothing to disclose. Planners and Editorial Staff - PIM has nothing to disclose. The Review Education Group has nothing to disclose.
Accreditation Statement: In support of improving patient care, this activity has been planned and implemented by PIM and the Review Education Group. PIM is jointly accredited by the Accreditation Council for Continuing Medical Education, the Accreditation Council for Pharmacy Education and the American Nurses Credentialing Center to provide CE for the healthcare team. PIM is accredited by COPE to provide CE to optometrists.
Credit Statement: This course is COPE-approved for two hours of CE credit. A127478 and course ID 89016-GL. Check with your local state licensing board to see if this counts toward your CE requirement for relicensure.
Disclosure of Unlabeled Use: This educational activity may contain discussion of published and/or investigational uses of agents that are not indicated by the FDA. The planners of this activity do not recommend the use of any agent outside of the labeled indications. The opinions expressed in the educational activity are those of the faculty and do not necessarily represent the views of the planners. Refer to the official prescribing information for each product for discussion of approved indications, contraindications and warnings.
Disclaimer: Participants have an implied responsibility to use the newly acquired information to enhance patient outcomes and their own professional development. The information presented in this activity is not meant to serve as a guideline for patient management. Any procedures, medications or other courses of diagnosis or treatment discussed or suggested in this activity should not be used by clinicians without evaluation of their patient’s condition(s) and possible contraindications and/or dangers in use, review of any applicable manufacturer’s product information and comparison with recommendations of other authorities.
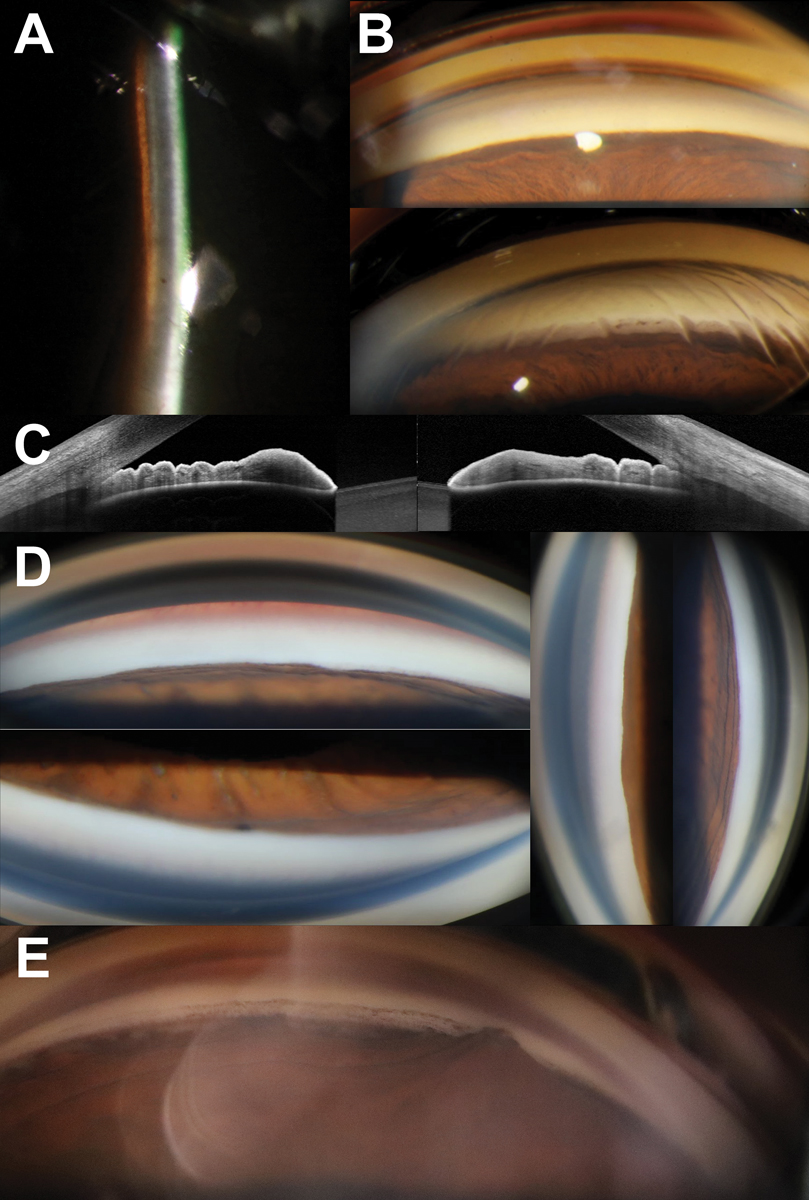 |
Fig. 1. (A) Narrow van Herick angle estimation of 0.1:1. (B) Gonioscopy with no angles visible in primary gaze without indentation (top) with deepening as well as increased visibility of angle structures with associated corneal stress lines on indentation (bottom). (C) Obvious iridotrabecular contact in both nasal and temporal angles on anterior segment OCT. (D) No visible structures in all quadrants in a patient with an acute angle closure attack. (E) Focal peripheral anterior synechiae in a patient with a history of an acute angle closure attack following clear lens extraction. Click image to enlarge. |
Despite advancements in ocular imaging over the past decade, there is no single parameter used for glaucoma diagnosis. Currently, it is usually made using a Bayesian approach whereby various components of a glaucoma examination such as intraocular pressure (IOP), visual field testing and structural assessment uniquely contribute to the diagnostic decision.1 As such, the presentation of glaucoma and its physical manifestations can be diverse. This article will walk readers through the range of structural findings across the glaucoma spectrum using an illustrative approach and will also cover the pathophysiology of structural glaucomatous features.
Anterior Segment Examination
There are several conditions in this area that range from narrow angles to secondary conditions that can give rise to an increase in IOP. This section describes their key clinical features associated with glaucoma.
Angle closure spectrum disease. The first and arguably most important aspect of the anterior segment examination is to differentiate between open- and closed-angle disease.2 Most patients with angle closure disease require immediate intervention to control IOPs and manage acute symptoms to prevent vision loss.3
Angle closure spectrum disease can be divided into primary and secondary.4 Pupillary blocks account for the majority of primary angle closure disease.5,6 In pupillary block, there is an increased pressure gradient that causes anterior bowing of the peripheral iris and subsequently iridotrabecular contact, preventing aqueous outflow through the trabecular meshwork.6 In secondary angle closure, which typically presents more unilaterally compared to primary angle closure, iridotrabecular contact arises from other sources, such as ectopia lentis or neovascularization.7 Secondary angle closure may require different treatments than primary angle closure, thus it is important for clinicians to distinguish between the two.8,9
Photo Atlas of Ocular DiseaseReview of Optometry has created the following new resource—a photo atlas of ocular diseases across the entire spectrum of eye care. In addition to over 200 high-quality photos, you'll find clinical pearls for each condition and links to relevant articles that provide detailed guidance. An index of the entire atlas can be found here or you can check out the conditions featured in their respective categories: |
Although slit lamp examination is not diagnostic for angle closure spectrum disease, it can be used to assess for features associated with acute angle closure attacks. Depending on the IOP and duration of angle closure, ocular signs may include conjunctival hyperemia, corneal edema, a fixed iris and/or anterior chamber inflammation. Clinicians need to assess the anterior segment carefully for these signs and exclude other conditions such as neovascular glaucoma that may share some these features.
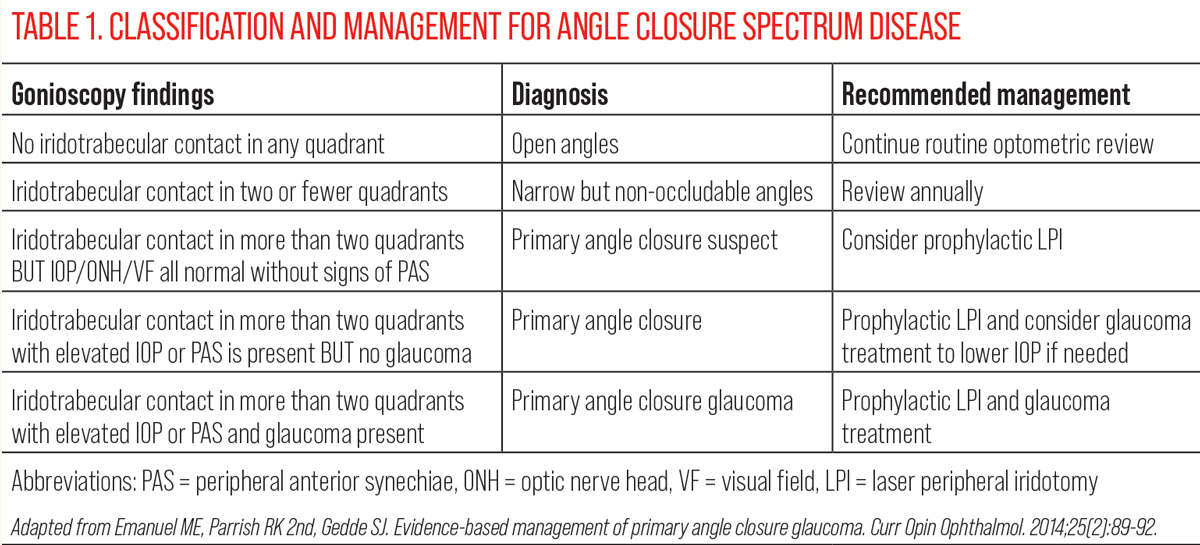
While slit lamp examination can also be used to screen patients for narrow angles using the techniques such as van Herick estimation or anterior-segment optical coherence tomography (AS-OCT), gonioscopy remains the gold standard in staging and guiding management of angle closure.9 The classification and management for angle closure spectrum disease is summarized in Table 1. Gonioscopy should be performed both in primary gaze and with off-axis viewing or lens tilt. This allows for the differentiation between pseudo and true iridotrabecular contact in instances where the pigmented trabecular meshwork cannot be visualized in primary gaze. In patients with iridotrabecular contact, the next step of the gonioscopic examination is to assess for the presence or absence of synechiae. This is performed through indentation using the goniolens. In areas where the angle does not deepen with indentation, this is suggestive of synechial closure. An example of circumferential synechial closure is shown in Figure 1.
Peripheral anterior synechiae develops from prolonged contact between the trabecular meshwork and iris. On gonioscopy, iris imprinting manifests as focal patchy pigmentation on the trabecular meshwork.10 This can be used to identify areas at risk of developing synechiae as the pigment in this area is thought to arise from intermittent touch between the trabecular meshwork and iris. Synechiae can develop in both broad and focal patterns. Interestingly, while the most common location for broad synechiae to develop is the superior quadrant, focal synechiae have no predilection for specific locations or clock hours.11 The amount of IOP elevation corresponds to the extent of synechiae.11 Clinical trials often deem one clock hour of synechiae as significant, but in clinical practice, IOP is also dependent on other factors and the functionality of the remaining non-occluded angle.
 |
|
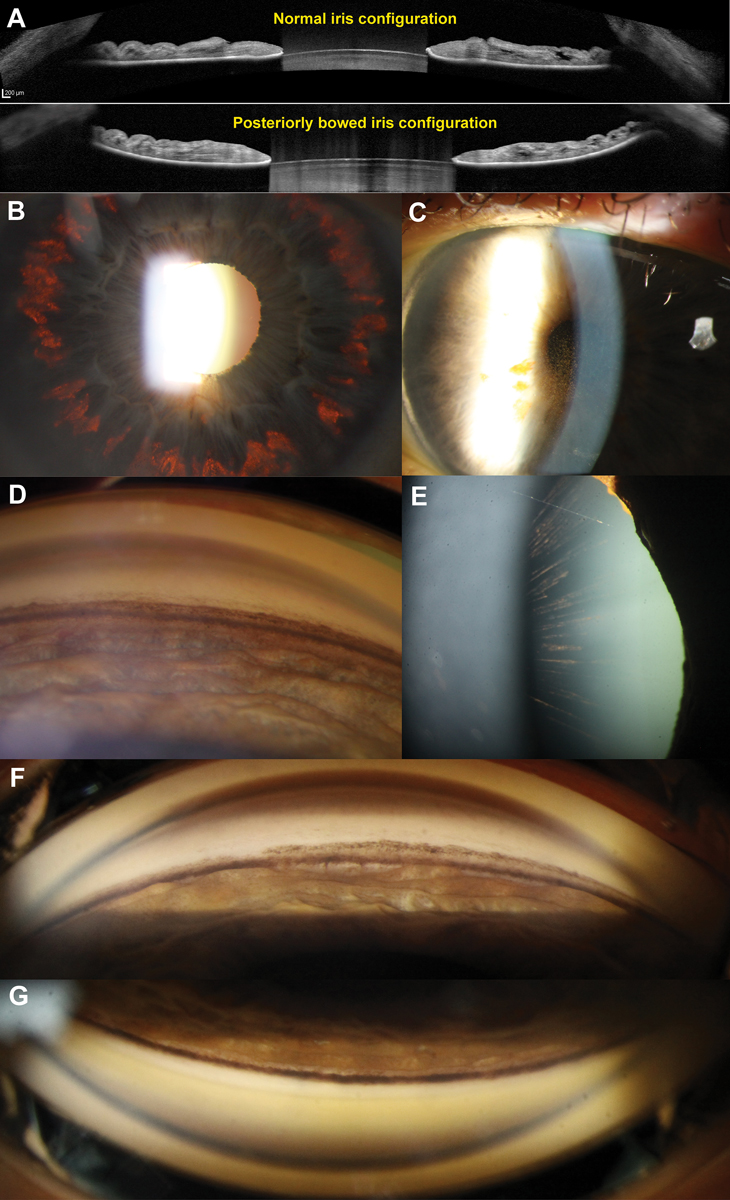
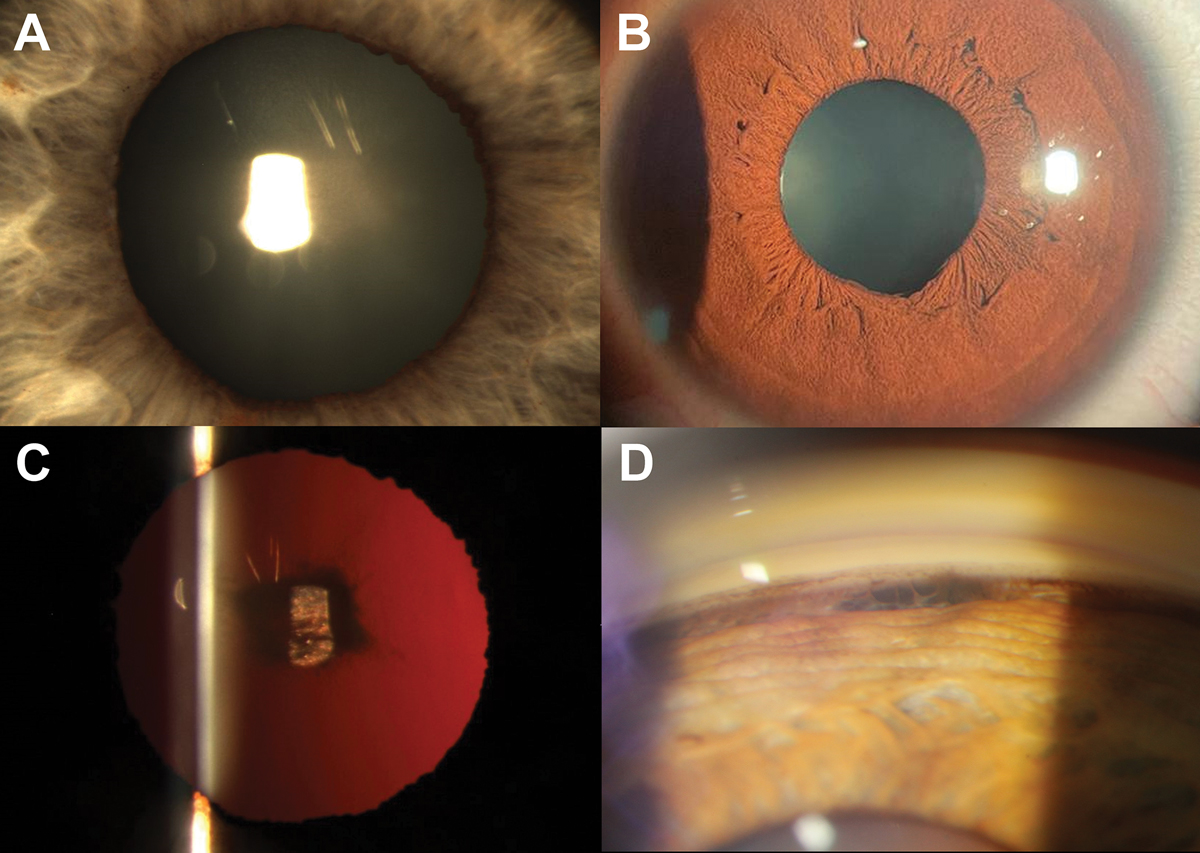
Fig. 2. (A) AS-OCT of a normal (top) and posteriorly bowed iris configuration in a patient with PDS (bottom) with contact between the mid-peripheral iris and anterior lens surface. (B) Retroillumination technique highlights mid-peripheral iris transillumination defects. (C) Endothelial pigment deposition (also known as Krukenberg’s spindle). The flow of aqueous convection currents results in denser central deposition, which gives rise to the spindle-like pattern. (D) Dense homogenous increased pigmentation within the angle, particularly along the trabecular meshwork and anterior to Schwalbe’s line (also known as Sampaolesi’s line). In active PDS, all four quadrants will have a similar extent of pigmentation. There is also posterior bowing of the iris profile. (E) Long anterior lens zonules (LAZs) with associated pigmentation. In PDS, the anterior lens zonules are more centrally located on the lens capsule and often appear pigmented due to contact with the posterior iris surface. (F) An example of “pigment reversal sign” in burnt out PDS, where the inferior angle appears less densely pigmented (top) compared with the superior angle (bottom). This is considered to be a sign of inactive disease. Click image to enlarge. |
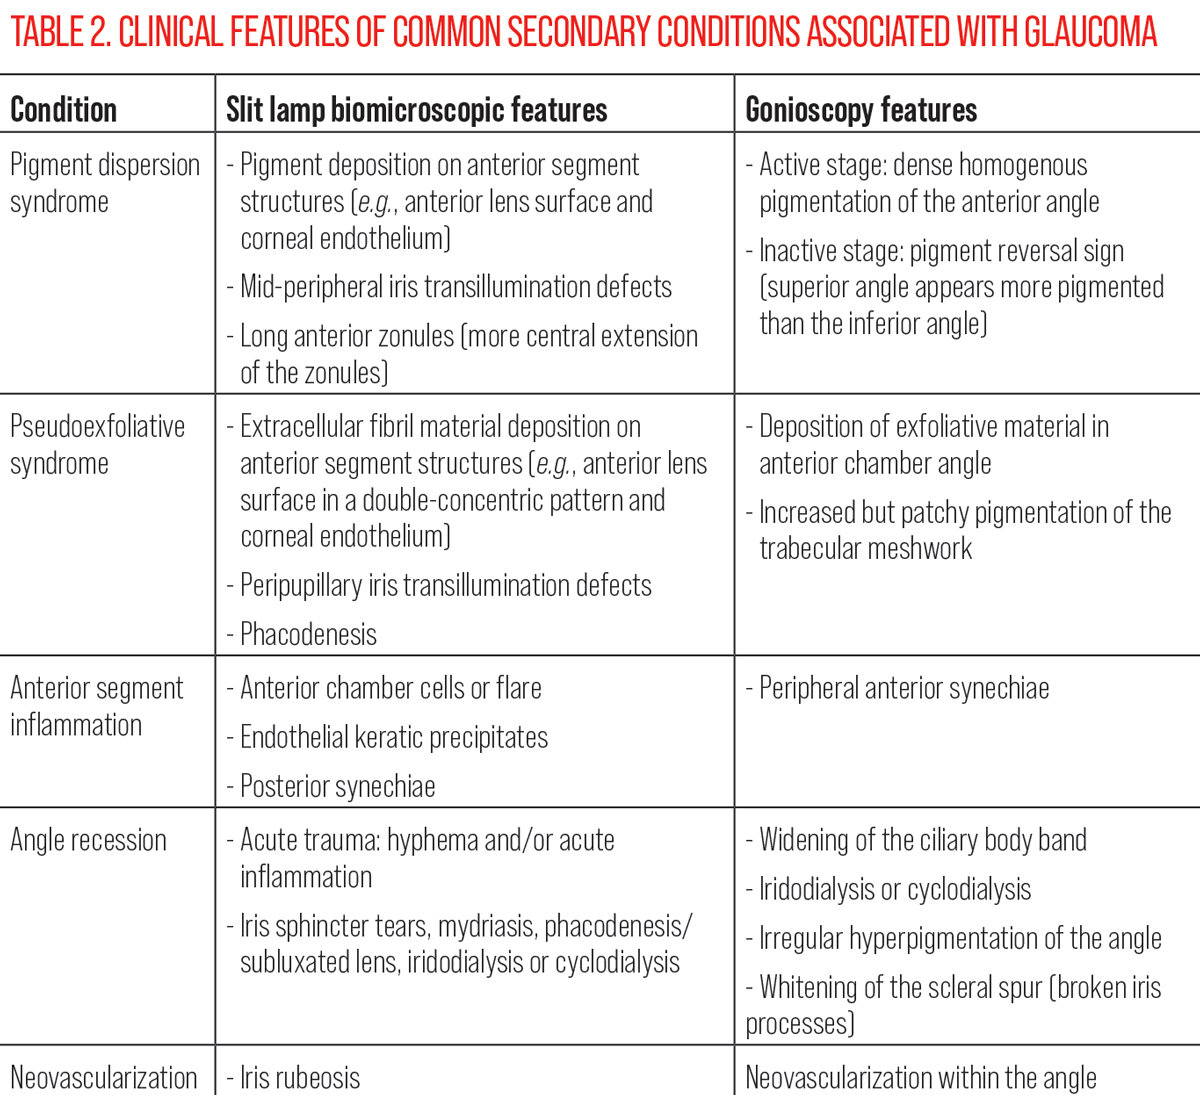
Secondary conditions. Although secondary glaucomas only account for approximately one-fifth of the glaucoma population, much like closed-angle glaucomas, they are associated with poorer visual outcomes, higher IOPs and more advanced disease at the time of diagnosis.12 Given that the type of glaucoma has implications to guide intervention selection, optometrists must be able to recognize relevant clinical signs and accurately diagnose secondary conditions. In this section, we will cover features in conditions such as pigment dispersion syndrome, pseudoexfoliation syndrome, blunt ocular trauma, anterior segment neovascularization and inflammation. A summary of the common presenting features of each condition is summarized in Table 2.
Pigment dispersion syndrome (PDS) is characterized by abnormal liberation of pigment from the posterior iris pigment epithelium and resultant deposition of pigment on ocular structures such as the trabecular meshwork, corneal endothelium and the anterior chamber. Deposition of pigment within the trabecular meshwork can result in an increase in IOP and subsequent development of glaucoma. Anatomically, posterior bowing of the peripheral iris is thought to give rise to increased mechanical friction between the peripheral iris and anterior lens zonule bundles.13
Active PDS most commonly presents with three classical signs: pigment deposition on the corneal endothelium in a spindle-like pattern, mid-peripheral radial iris transillumination defects and homogenously increased pigmentation of the trabecular meshwork. The clinical presentation may vary based on race.14,15 For example, in populations with more pigmented irises, it is less common to see mid-peripheral iris transillumination defects due to a greater iris thickness.15 In these patients, clinicians should instead look for the presence of peripheral iris bowing, Krukenberg’s spindle or radial lenticular pigmentation to reliably diagnose PDS. Other clinical features can include: the presence of long anterior lens zonules, pigment showers, anisocoria, heterochromia and deposition of pigmentation on the anterior and posterior surface of the crystalline lens.16
In addition to assisting in the diagnosis of PDS, careful gonioscopic examination of the trabecular meshwork can also help with disease prognostication. Glaucoma disease severity has been shown to correlate with the intensity of trabecular meshwork pigmentation whereby a heavier degree of pigmentation is associated with more advanced disease.17 While AS-OCT is not able to visualize the majority of PDS features, it may be useful in characterizing the iris-lens relationship to assess for peripheral iris bowing, similar to traditional ultrasound biomicroscopy.18 The clinical features associated with PDS are shown in Figure 2.
 |
| Click table to enlarge. |
As pigment liberation is dependent on contact between the peripheral iris and lens zonules, changes to this configuration associated with age can lead to disease inactivity, known as the “burnout phase.”19,20 This manifests with “filling in” of iris transillumination defects secondary to migration of iris pigment epithelial cells from adjacent areas.19,20 Gonioscopy reveals “pigment reversal sign” whereby the superior angle appears more heavily pigmented when compared to the inferior angle (Figure 2).19,20 This disparity between the superior and inferior angles is thought to arise from more rapid removal of pigment from the trabecular meshwork in the inferior angles due to the direction of aqueous convection currents. It is important to be able to differentiate between active and burnt out PDS given the implications for treatment intensity.
Pseudoexfoliation (PXF) syndrome is a systemic condition primarily affecting ocular structures through the deposition of white extracellular fibril material on various ocular structures.21 The primary sites of deposition include: the trabecular meshwork, corneal endothelium anterior chamber, anterior lens capsule as well as pupillary margin and anterior iris surface.22 The accumulation of PXF material with the trabecular meshwork results in focal collapse of Schlemm’s canal, subsequently reducing aqueous outflow facilities and increasing IOP.23 Patients with PXF glaucoma may require a more aggressive approach to treatment as they have a poorer response to topical therapies and often require surgical intervention to sufficiently control IOP.
Anterior segment examination will reveal the following constellation of features: PXF material on the anterior lens capsule in a bull’s-eye pattern as well as on the pupillary margin, patchy increased pigmentation of the trabecular meshwork and peripupillary iris transillumination defects. The bull’s-eye pattern on the anterior lens surface can be broken down into three zones: central zone, middle and peripheral.22
 |
|
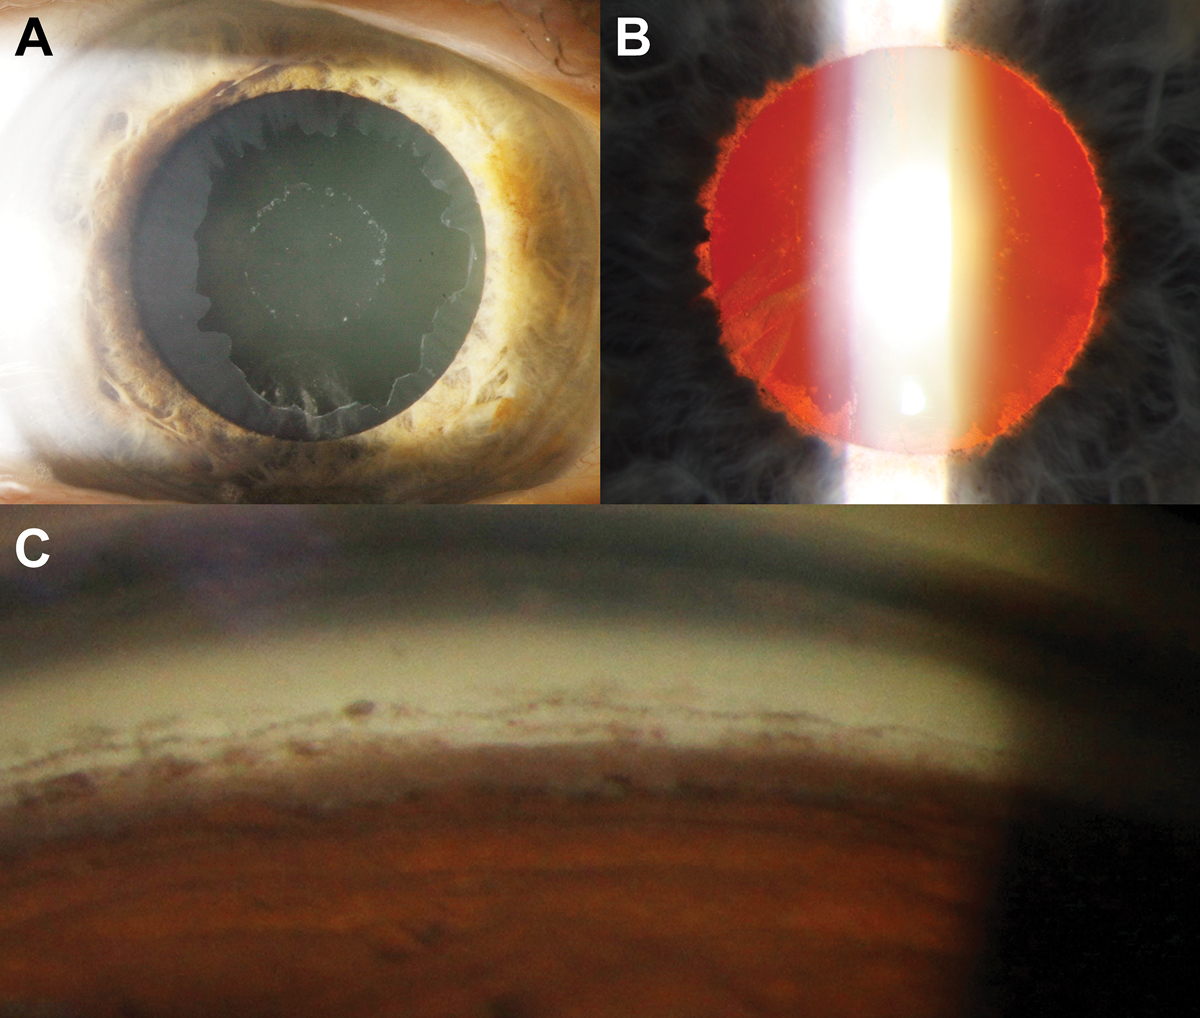
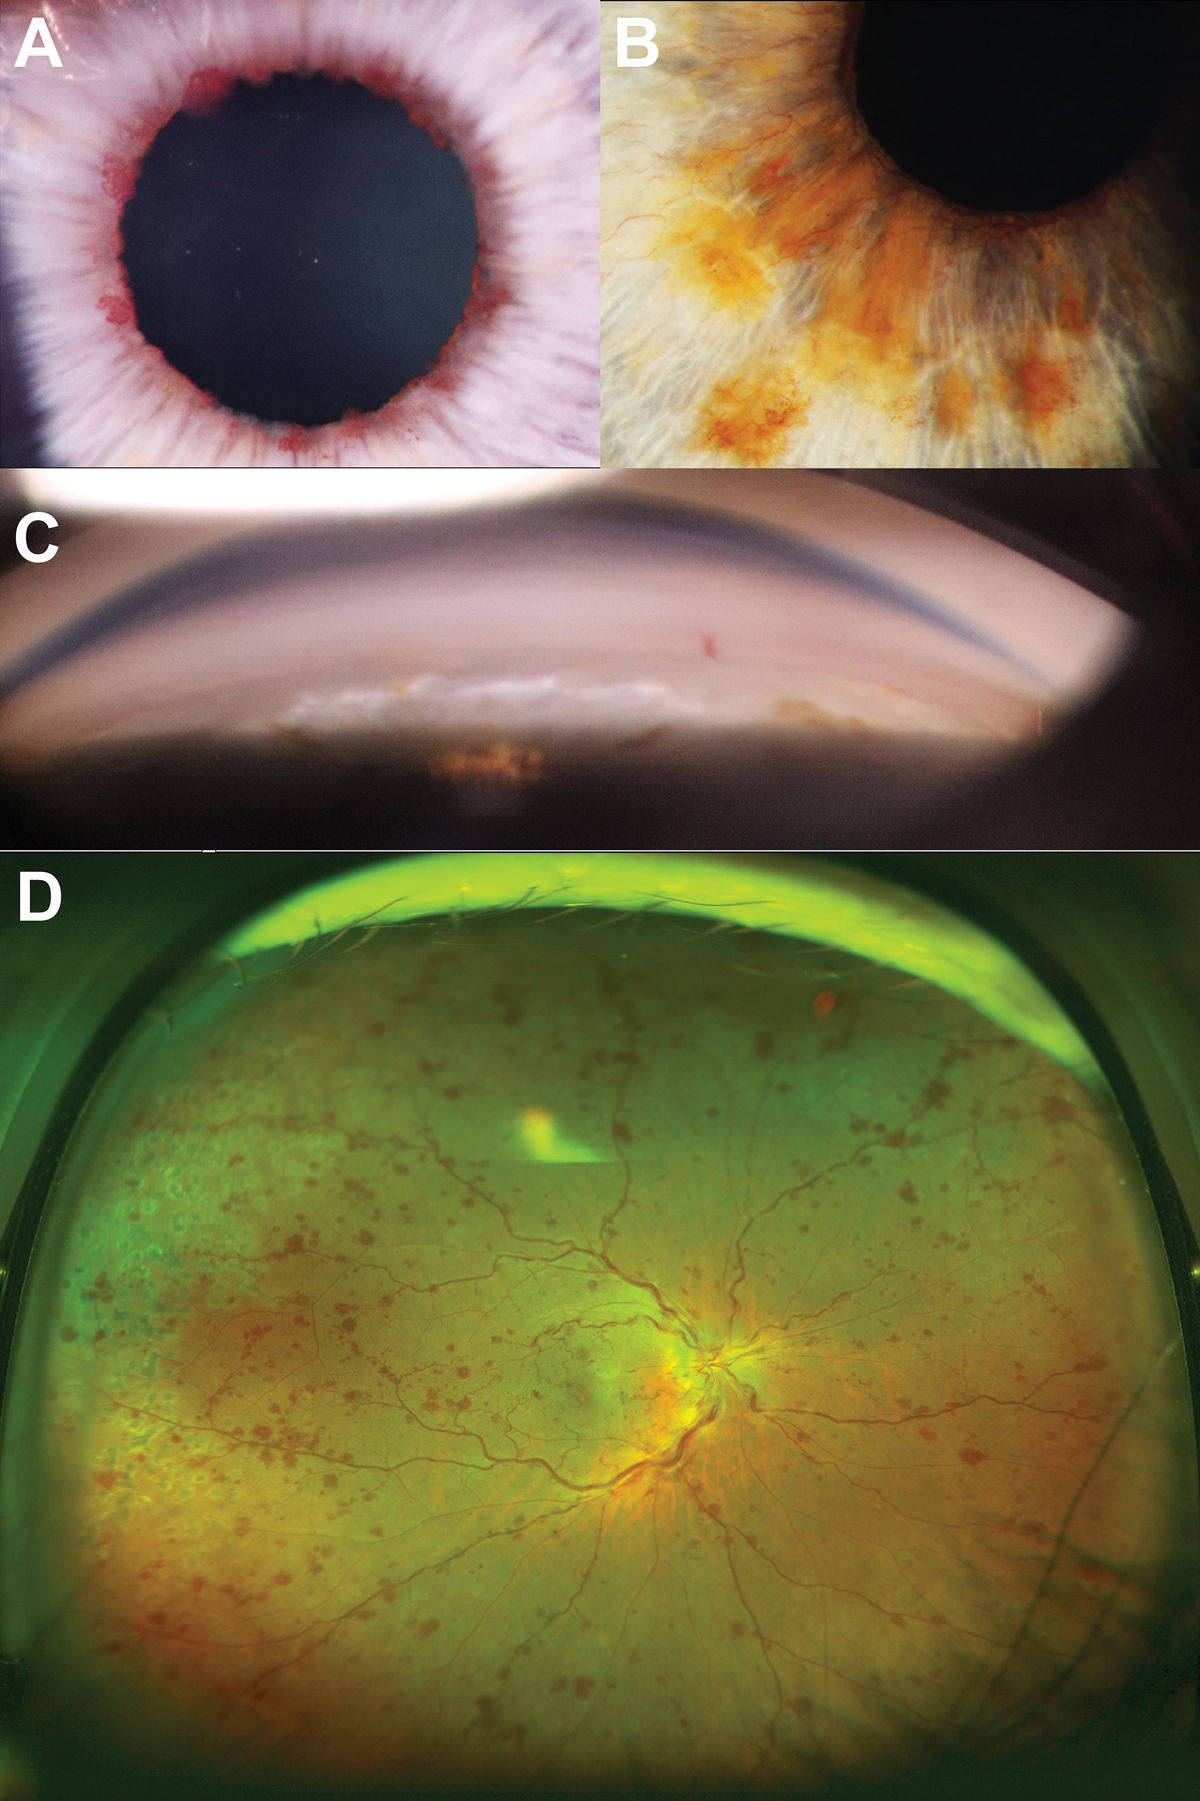
Fig. 3. (A) Bull’s-eye pattern of pseudoexfoliative material on the anterior lens capsule. (B) Retroillumination shows loss of the pupillary ruff as well as peripupillary iris transillumination defects. (C) There is increased but patchy pigmentation (brown sugar-like appearance) of the trabecular meshwork on gonioscopy as well as Sampaolesi’s line. The inferior angle typically appears more pigmented compared with the other angles. Click image to enlarge. |
The central zone presents with a well-demarcated curled edge and corresponds with the resting position of the natural pupil. The middle clear zone arises from contact between posterior iris surface and PXF material on the lens. As a result of this contact, there is loss of iris pigment in this area which gives rise to iris transillumination defects in a peripupillary location. Like PDS, the pigment liberated through this mechanism can also deposit on various ocular structures including the trabecular meshwork, usually more prominent in the inferior quadrant. The peripheral bull’s-eye zone is only visible with pupil dilation. The clinical features associated with PXF syndrome are shown in Figure 3.
The irises of patients with PXF typically dilate poorly due to atrophy of the iris dilator muscle. Additionally, zonular weakness presenting as phacodenesis can also be observed in PXF. This can be elicited by instructing the patient to initiate eye movements which results in vibrating-like movement of the lens. Zonular weakness is thought to arise from infiltration of PXF material into the zonular bundles at the zonule anchorage points in the ciliary body.24 In extreme cases, secondary angle closure can occur with subluxation of the lens. Practically, the presence of PXF may also present as an obstacle to cataract surgery.25
Angle recession. Blunt trauma to the globe can result in tearing of both longitudinal and circular fibers of ciliary body muscle.26 This tearing within the ciliary body muscle has been thought to lower the muscle’s tension on the scleral spur, which results in subsequent narrowing Schlemm’s canal thus reducing aqueous outflow and increasing IOP.
Additionally, while there may also be associated damage to the trabecular meshwork and Schlemm’s canal affecting IOP from the initial trauma, alterations to these structures such as scarring or fibrosis that can give rise to elevated IOPs can occur up to decades post-injury.27 Thus, patients with a history of blunt trauma require lifelong monitoring for angle recession and trabecular function. While not all patients develop angle recession, the presence of a hyphema at the time of trauma, alongside the extent of recession, is highly predictive of angle recession development in future.28
 |
|
Fig. 4. (A) Nasal loss of the pupillary ruff in a patient with a history of blunt trauma to the eye. (B) Focal traumatic mydriasis between five and six o’clock suggest iris sphincter damage in this location. (C) Traumatic cataract with a petaloid pattern seen with retro illumination. (D) Focal widening of the ciliary body band observed in the superior mirror on gonioscopy. Click image to enlarge. |
Gonioscopy is the key clinical test to diagnose angle recession whereby clinicians will observe widening of the ciliary body band corresponding to the areas of recession. It should be noted that there is significant heterogeneity in the physiological width of the ciliary body between individuals thus it is critical to perform an intra-eye comparison to prevent misdiagnosis. While not diagnostic, slit lamp examination is useful to assess for other signs of previous ocular trauma. These include iris tears, focal or diffuse pupillary dilation, Vossius ring, iridodialysis, iridodonesis, corneal changes, phacodonesis or hyphema in more acute instances of trauma.29 This may be useful as some patients with clear signs of ocular trauma such as iris sphincter tears may not report a history of trauma. The anterior segment features of angle recession are shown in Figure 4.
Neovascularization of the iris occurs due to an increase in vasoproliferative factors such as inflammatory cytokine interleukin 6 and vascular endothelial growth factor (VEGF).28 Causes of increased VEGF classically include diabetic retinopathy and retinal vascular occlusions but may also include pro-inflammatory conditions, such as chronic retinal detachment and intraocular tumors.30 The increased level of VEGF interacts with iris’ capillary endothelial cells to form new vessels without intracellular tight junctions which subsequently leak.
The natural history of iris neovascularization in the context of glaucoma can be broken down into three stages: (1) active neovascularization, (2) open-angle glaucoma and (3) closed-angle glaucoma.31 During the active neovascularization stage, tuft-like vessels are commonly observed along the pupillary margin of the anterior iris surface. As the condition progresses to the open-angle glaucoma stage, the new vessels extend peripherally towards the angle and forming a fibrovascular membrane obstructing trabecular outflow.
 |
|
Fig. 5. (A) Tuft-like neovascularization along the pupillary margin. (B) Proliferation of the iris neovascularization from the across the anterior iris surface. (C) Neovascularization seen within the angle on gonioscopy. (D) Ultra-widefield imaging of the active central retinal vein occlusion in the right eye from the patient shown in B and C. Click image to enlarge. |
In the closed-angle glaucoma stage, there is contraction of proliferated tissue distorting the natural iris contour, leading to synechiae-like angle closure. An example of a patient with a history of central retinal vein occlusion and subsequent iris neovascularization along the pupillary margin is shown in Figure 5. Patients with fully developed neovascular glaucoma typically present with very elevated IOPs, bulbar conjunctival hyperemia and corneal edema. This presentation may mimic an acute angle closure attack as corneal edema can confound iris and angle evaluation. The management of neovascular glaucoma includes management of IOP and a need to address the underlying disease.
Anterior segment inflammation (uveitis). Glaucoma can arise both directly and indirectly as a result of anterior segment inflammation.32 Broadly, uveitic glaucoma can be broken down into open-angle and closed-angle presentations. In open-angle presentations, changes to the blood-aqueous barrier during inflammation lead to the accumulation of inflammatory cells (such as keratic precipitates) within the trabecular meshwork which can be observed gonioscopically. This, in conjunction with swelling of the trabecular tissue, leads to a reduction in aqueous outflow facility. Over time, permanent trabecular remodelling can lead to reduced functionality in aqueous outflow.
Adjunctive to the inflammatory effects of uveitis, corticosteroid medication used in the management of anterior segment inflammation may cause iatrogenic IOP elevation. Several risk factors for local corticosteroid responsiveness have been proposed, such as the extremes of age, a high baseline IOP, personal or family history of glaucoma and certain genotypes.33 Local administration of corticosteroid may be necessary over a long period of time and at recurrent episodes. Thus, there are more opportunities for corticosteroid responsiveness to lead to IOP-mediated glaucomatous damage.
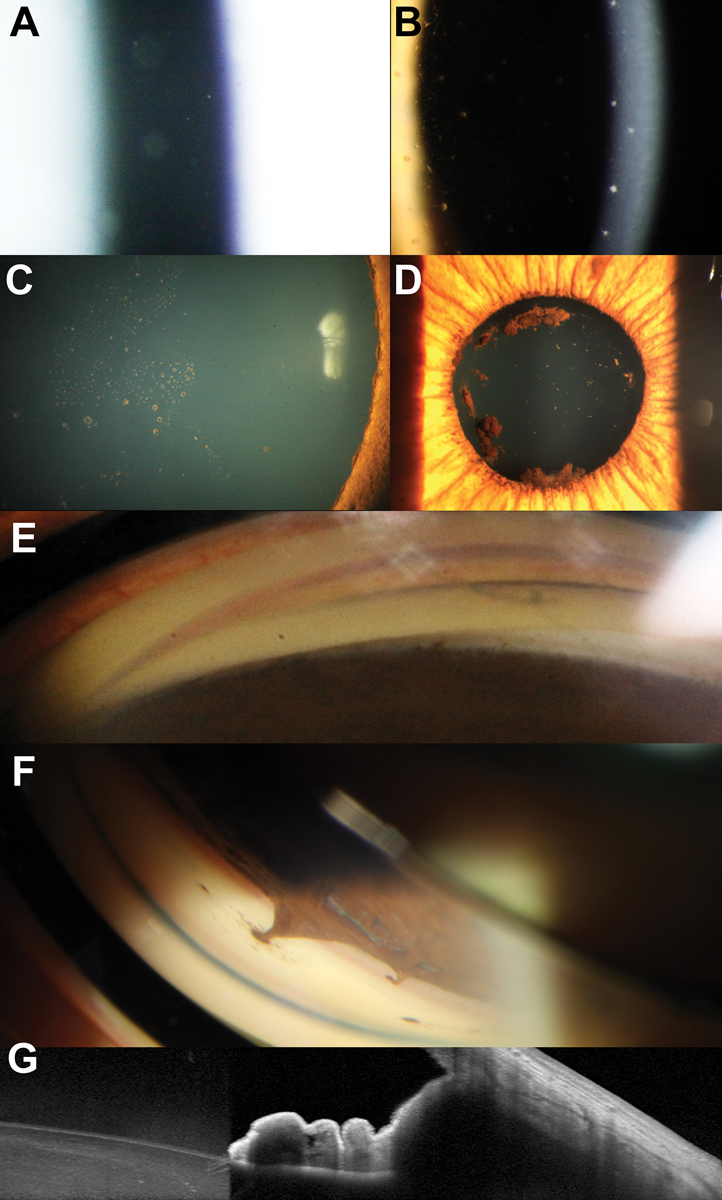
In closed-angle presentations, anterior and posterior synechiae can lead to elevations in IOP. Posterior synechiae are characterized by adhesion between the posterior iris surface and anterior lens surface. Depending on the extent of adhesion and interruption to aqueous flow from the anterior chamber, this can result in increased pressure behind the peripheral iris leading to iris bombe. Peripheral anterior synechiae can also contribute to increased IOP in closed-angle presentations. Anterior segment features associated with acute or chronic inflammation are shown in Figure 6.
 |
| Click table to enlarge. |
Funduscopic Assessment of the Optic Nerve
Stereoscopic examination of the optic nerve head is another major component of a comprehensive glaucoma assessment. Glaucomatous optic nerve changes are classically described as a diverse range of “characteristic” features, including diffuse or focal (notching) loss of the neuroretinal rim, widening and deepening of the optic cup, corresponding retinal nerve fiber layer (RNFL) loss touching the rim and disc hemorrhages.34 A reason for this spectrum of features is because no single feature offers adequate sensitivity or specificity for diagnosis.35,36 Also, some features may be seen in other optic neuropathies.37,38 Thus, it is the combination of features that determines the likelihood of glaucoma. An example of disc changes in early, moderate and advanced glaucoma is shown in Figure 7.
Neuroretinal rim changes. A hallmark sign of glaucoma is thinning of the neuroretinal rim.36 In this disease, the inferotemporal sector is the most common site of initial damage.39 Classically, the vertical poles are affected (inferior and superior) more so than along the horizontal axis. As glaucoma progresses, the temporal rim is more likely to demonstrate loss prior to nasal involvement in later stages.37
In clinical practice, several techniques help identify these changes. On fundoscopic examination, following the contour of the cup to inspect for color and contour changes in the ovality of the cup carefully may help find irregularities suggestive of rim changes. It is important to acknowledge that color is often a challenging cue for judging neuroretinal rim.40 However, if a clinician detects similarities in the color of the cup and rim, it may suggest pallor of the rim as it should normally be more orange or pink with perfusion, relative to the cup.41 This would suggest an alternative diagnosis to glaucoma.
 |
|
Fig. 6. (A) Assessment of the anterior chamber shows anterior chamber cells. (B) Keratic precipitates and pigment on the corneal endothelium. (C) Multifocal pigmentation on the anterior lens surface in a patient with recurrent uveitis. (D) Larger agglomerates of pigment on the anterior lens capsule suggestive of broken posterior synechiae. (E) Broad peripheral anterior synechiae manifesting with narrowing of the angle in the left side of the image. (F) Focal peripheral anterior synechiae adjacent to an area of iris atrophy. (G) AS-OCT through an area of peripheral anterior synechiae showing anterior displacement of the peripheral iris resulting in iridotrabecular contact. Click image to enlarge. |
Traditionally, blood vessel changes such as baring and bayonetting have been proposed as markers of glaucoma.42,43 These terms are not part of current definitions of structural changes in glaucoma because they are poorly defined. For reference, we refer to baring as the change in blood vessel contour as it enters or exits the optic cup as it touches the neuroretinal rim, and bayonetting specifically refers to the situation in which a sharp vertical drop (along the z-axis) at the margin of the markedly thin neuroretinal rim.41,44 Therefore, the latter would represent advanced neuroretinal rim loss. Because these blood vessel changes are poorly defined and with no accepted grading system, we suggest that these are used as surrogates of neuroretinal rim integrity.
Neuroretinal rim changes may be focal or diffuse in morphology.39 Historically, focal and diffuse changes have been associated with pressure-defined phenotypes of glaucoma: normal or low-tension and high-tension, respectively.45 This has remained a subject of debate in the literature.46 An example of the proposed patterns of loss for low vs. high tension phenotypes of glaucoma is shown in Figure 8.
Due to conflicting evidence in the literature, it is important for clinicians to recognize that focal or diffuse changes may occur in various phenotypes of glaucoma, irrespective of the level of IOP. The extent of neuroretinal rim changes may provide insights into the expected stage of glaucoma (alongside other features as described below).34 Since the neuroretinal rim is a measure of retinal nerve fiber volume at the optic disc, its losses provide insight into the amount of neural tissue remaining. Therefore, focal losses may be more representative of an earlier stage of the disease process, and widespread diffuse defects may potentially indicate more extensive and advanced glaucoma.39
Glaucomatous cupping and the cup-to-disc ratio. Cupping is one of the quintessential descriptors of glaucoma and is synonymous with pathological neural tissue loss. Historically, clinical records of the optic nerve have been distilled into cup-to-disc ratio as a simplified metric of glaucoma likelihood. Current paradigms discourage the sole use of the cup-to-disc ratio because of its relative imprecision in differentially diagnosing glaucoma.
Like neuroretinal rim changes, cupping needs to be contextualized. The recommendation is that a record of cup-to-disc ratio must always be accompanied by a descriptor of disc size.44 Relatively speaking, a larger disc size is more likely to be accompanied by a larger cup, and correspondingly for a smaller-sized disc. Therefore, an apparently large cup-to-disc ratio is more likely to be anomalous in a relatively smaller disc instead of a larger disc.
Another feature that often accompanies a description of the cup-to-disc ratio is the visibility of the lamina cribrosa. Similar to the cup depth, visibility of the lamina cribrosa is also regarded as a surrogate for decreased volume of neural tissue.47 Recently, there has been substantial research interest in lamina cribrosa parameters, such as thickness, curvature, orientation and pore size.48,49 As with cup-to-disc ratio, we recommend that the visibility of the lamina cribrosa is documented as part of the comprehensive optic disc description.
 |
|
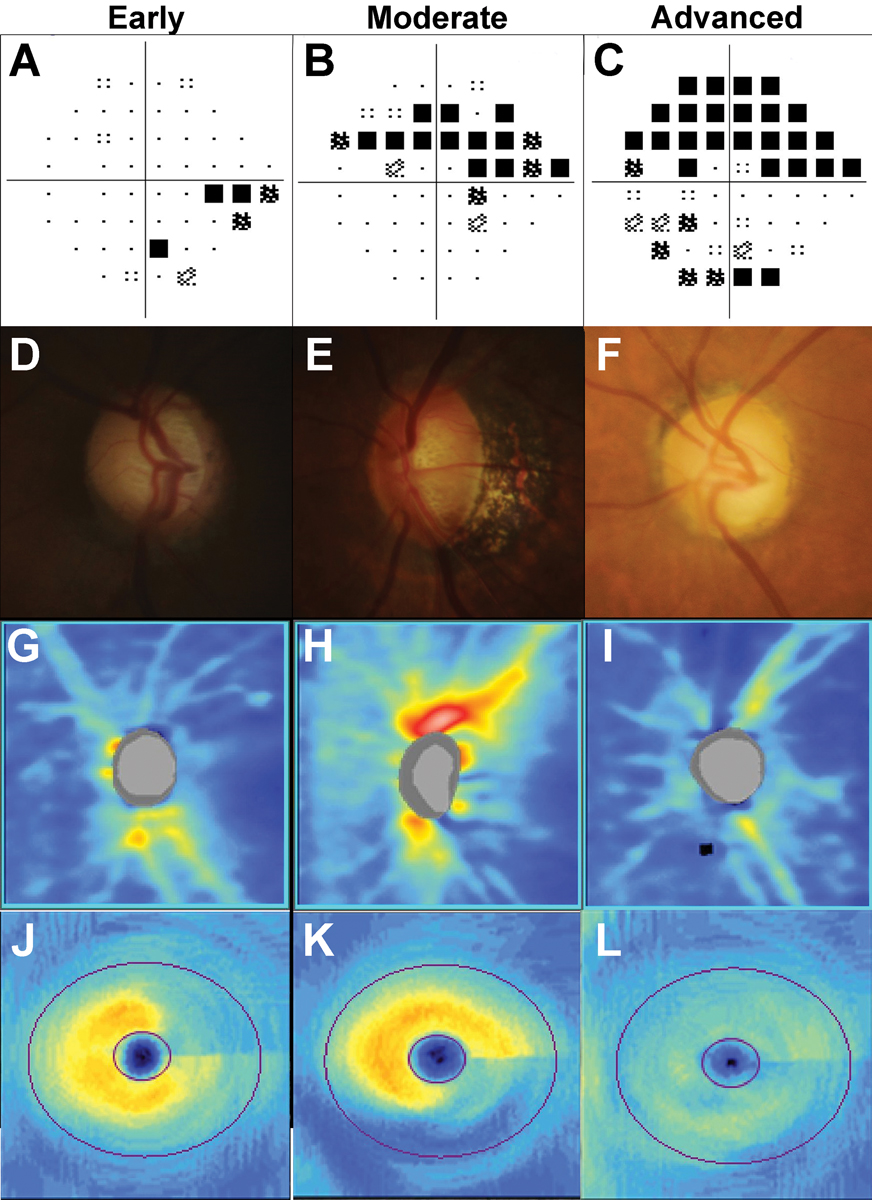
Fig. 7. Examples of early, moderate, and advanced glaucoma staged using visual field severity. In A to C, 24-2 visual field test results: (A) Inferior nasal step in early glaucoma. (B) Superior arcuate defect in moderate glaucoma. (C) Dense superior arcuate defect with an inferior cluster of reduction in advanced glaucoma. In D to F, disc photographs: (D) Thin superior neuroretinal rim in early glaucoma, (E) Marking loss of the inferior neuroretinal rim with a disc hemorrhage at the inferior disc. (F) Generalized concentric loss of the neuroretinal rim. In G to I, OCT RNFL heat maps: (G) Superotemporal loss of the RNFL. (H) Deep inferior loss of the RNFL. (I) Supertemporal and inferotemporal loss of the RNFL. In J to L, OCT ganglion cell analysis heat maps: (J) Superior arcuate wedge-like loss. (K) Wide inferior arcuate loss. (L) Generalized loss of the ganglion cell-inner plexiform layer. Click image to enlarge. |
RNFL defects. With visible changes at the optic nerve head (rim and cup), there must accordingly be upstream pathological features; these are the RNFL defects.50 Typically, glaucomatous RNFL defects touch the optic disc, and non-contiguous defects are more likely to be attributable to other pathologies.
In the earlier stages of glaucoma, RNFL defects are described as wedge- or arcuate-shaped, following a course expected from focal defects at the optic nerve.50 In diffuse phenotypes of glaucomatous damage, the RNFL may also be generally reduced in thickness.51 A notable feature of these defects that may be better appreciated using ocular imaging is the gradient of structural change at its borders.50 This is defined as a gradual change from a region of normality (nerve fibers intact) to a region of pathology.52 The gradual change can be considered to resemble a “leading edge” where there are anatomical regions at risk of progression. This gradient of structural change is an important feature in glaucoma, as it contrasts profoundly with other retinal pathologies such as retinitis pigmentosa, in which there is a clear delineation between the region of normality and region of pathology. Therefore, the gradient of RNFL change may be used to differentiate glaucoma from non-glaucomatous causes of RNFL loss.
Disc hemorrhages. Sometimes eponymously referred to as Drance hemorrhages, this feature may be seen alongside other glaucomatous structural change. By definition, a disc hemorrhage associated with glaucoma is a linear hemorrhage following the trajectory of the RNFL bundles, occurring within the RNFL and within one disc diameter of the disc margin.53 Therefore, other morphologies, such as splotchy, ill-defined and in the pre-retinal space, should not be considered to be related to glaucoma.
Their significance has been debated in the literature. Some studies have suggested that disc hemorrhages are harbingers of glaucomatous change, as they are an outward manifestation of ischemic stress to the RNFL.54 However, classically, the Ocular Hypertension Treatment Study suggested that disc hemorrhages may be an inevitable part of the glaucoma continuum and that detecting them is merely an incidental finding during a patient’s follow-up.55
While it may not compel the clinician to modify treatment (treatment changes are the domain of actual structural and/or functional progression), they may signal the need to consider alterations to follow-up or further investigations for vascular comorbidities.
Peripapillary atrophy (PPA). Like disc hemorrhages, this has been traditionally taught as a feature of glaucoma.56 However, unlike disc hemorrhages, PPA is a very non-specific sign that may be present in a host of other conditions, including in a non-pathologic manner in otherwise healthy eyes.57 PPA is described as a region of retinal atrophy involving various depths such as the neurosensory retina and retinal pigment epithelium touching the disc in various degrees. It is often described by clock hours and distance from the edge of the disc.
Recent studies supplemented by imaging modalities have enabled improved methods for classifying PPA into the alpha, beta and gamma zones.58,59 Its significance for glaucoma and key indices in such studies have also been mixed.60 Based on the poor correlations with indices of glaucoma structure and function, we recommend that peripapillary atrophy, if documented, remains a cursory retinal feature not specific to the glaucoma assessment.
 |
|
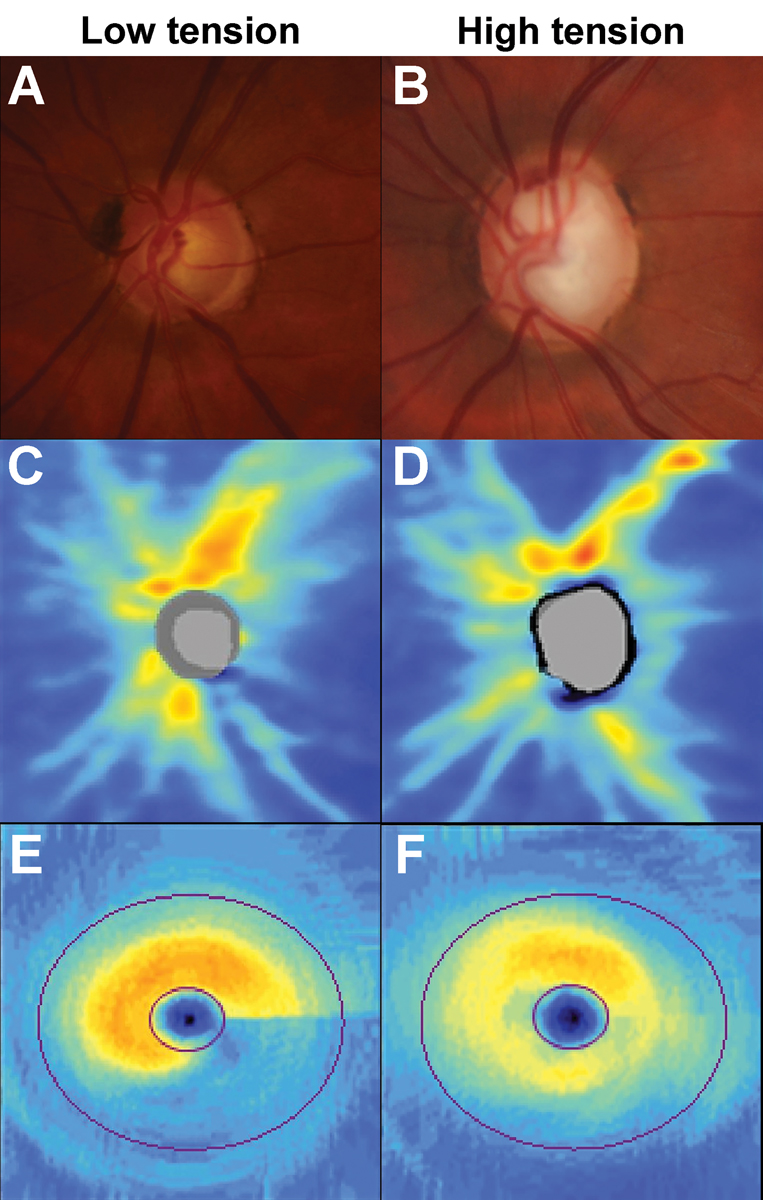
Fig. 8. Examples showing the patterns of loss in low- and high-tension glaucoma phenotypes. (A) Inferior neuroretinal rim thinning in a patient with pre-treatment intraocular pressures of 15mm Hg. (B) Neuroretinal rim thinning affecting the superotemporal, temporal and inferotemporal sectors in a patient with pre-treatment intraocular pressures of 47mm Hg. (C) OCT RNFL heat map shows deep but focal inferior loss in the low-tension phenotype. (D) OCT RNFL heat map shows diffuse but shallower loss in the high-tension phenotype. (E) Deep inferior arcuate loss in the OCT ganglion cell analysis heat map in the low-tension phenotype. (F) The heat map shows generalized but shallower loss is observed in the high-tension phenotype. Click image to enlarge. |
OCT
In the assessment of glaucoma, OCT allows for quantification of neural tissue affected in the disease, allowing clinicians to not only perform statistically based comparisons to normative databases but also quantitative progression analysis.61 These devices return several important parameters for clinical correlation. If we consider the framework for fundoscopic examination described previously, we can consider what are the pertinent features in the OCT result. Notably, clinicians need to be mindful of the different strengths and weaknesses with respect to the examination of these parameters when interpreting the results. An example of OCT patterns of loss in early, moderate and advanced glaucoma is shown in Figure 7.
RNFL loss. This result on the OCT can be qualitatively and quantitatively appreciated. The two main methods for qualitative examination of the RNFL are using the heat map (raw thickness map) and the deviation map. The heat map provides an en face view of the scan area, highlighting areas with retinal thickening in warmer colors (and even more relative thickening towards white) and thinner areas in cooler colors. At a glance, this enables the clinician to examine for the morphology of RNFL loss and its contiguity with the optic nerve head.
The deviation map is a similar en face view but shows a grey scale scanning laser ophthalmoscopy image with superpixels superimposed. The superpixels—often yellow or red—represent comparisons of RNFL thicknesses against the normative database.62 Similar to the heat map, clinicians should inspect the deviation map for statistically significant thickness reductions relative to the normative database and their morphologies.63 Additionally, B-scans can be leveraged to inspect for the gradient of structural change described above. Similarly, inspection of the retinal layers allows differential diagnosis of glaucoma from other retinal diseases.
One notable disadvantage of OCT quantitative parameters is the measurement floor effect.64 This value represents the lower limit at which measurements are reliable or significant. This value varies across devices and different locations. Once the measurement floor is reached, OCT information at that location is likely no longer clinically useful.65 While OCT may see more prevalent use in earlier stages of glaucoma, such as pre-perimetric glaucoma, advanced cases often require functional testing for progression analysis.
The TSNIT curve is often reported by OCT devices and represents an unfurled scan area at a fixed distance from the optic nerve head. This provides both qualitative and quantitative information on a cross section of the RNFL layer thickness and at once allows visualization of localized structural loss. These are often usefully accompanied by bands of the instrument’s normative limits.
Normative data. A core component of OCT analysis is the comparison of the individual patient’s data against a reference normative database.66 The parameters of the normative database differ across devices, so it is important to review this for any device in the practice. In most cases, OCT outputs use a traffic light or similar system (green indicating within the normative data range, yellow indicating borderline and red indicating outside the reference range) to provide a quick visual indicator for the clinician.
As expected, the validity of the comparisons is dependent on the parameters of the normative database.67 Variables such as age, sex, ethnicity/geographic region, refractive error and axial length (among others) are known to affect the measured structural values.68 It is also arguable that the composition of normative database comprises of an unusually healthy cross section of the general community. Therefore, clinicians are encouraged to interpret the traffic signals with caution and to instead inspect for trends within the individual’s results.
Takeaways
A glaucoma diagnosis draws upon several components of the optometric examination, ranging from slit lamp examination to interpretation of OCT findings. While no parameter can be used in isolation, they offer unique contributions to assist clinical decision-making related to both the diagnosis and treatment of glaucoma.
The authors would like to thank Nicola Lee for her assistance in identifying some of the clinical images included in this article.
Dr. Wang is the head of Glaucoma/Neuro-ophthalmology unit at the Centre for Eye Health (UNSW). She received numerous clinical and academic awards during her undergraduate optometry degree, including a research scholarship for her work in the Retinal Networks Laboratory. Her clinical and research interests lie in the diagnosis as well as management of glaucoma and other optic nerve diseases.
Dr. Phu is a clinician-scientist, holding the positions of lecturer at the School of Optometry and Vision Science, UNSW, and research fellow at Deakin University. His clinical, teaching and research activities are devoted almost exclusively to the understanding and care of patients with glaucoma and angle closure disease.
1. Stein JD, Khawaja AP, Weizer JS. Glaucoma in adults-screening, diagnosis and management: a review. JAMA. 2021;325(2):164-74. 2. Varma DK, Simpson SM, Rai AS, Ahmed IIK. Undetected angle closure in patients with a diagnosis of open-angle glaucoma. Can J Ophthalmol. 2017;52(4):373-8. 3. Andreatta W, Elaroud I, Nightingale P, Nessim M. Long-term outcomes after acute primary angle closure in a White Caucasian population. BMC Ophthalmol. 2015;15:108. 4. Wright C, Tawfik MA, Waisbourd M, Katz LJ. Primary angle-closure glaucoma: an update. Acta Ophthalmol. 2016;94(3):217-25. 5. Zhang N, Wang J, Chen B, et al. Prevalence of primary angle closure glaucoma in the last 20 years: a meta-analysis and systematic review. Front Med (Lausanne). 2020;7:624179. 6. Huang EC, Barocas VH. Active iris mechanics and pupillary block: steady-state analysis and comparison with anatomical risk factors. Ann Biomed Eng. 2004;32(9):1276-85. 7. Parivadhini A, Lingam V. Management of secondary angle closure glaucoma. J Curr Glaucoma Pract. 2014;8(1):25-32. 8. Ang LP, Aung T, Chua WH, et al. Visual field loss from primary angle-closure glaucoma: a comparative study of symptomatic and asymptomatic disease. Ophthalmology. 2004;111(9):1636-40. 9. Bruno CA, Alward WL. Gonioscopy in primary angle closure glaucoma. Semin Ophthalmol. 2002;17(2):59-68. 10. Rao HL, Mungale SC, Kumbar T, et al. Evaluation of blotchy pigments in the anterior chamber angle as a sign of angle closure. Indian J Ophthalmol. 2012;60(6):535-9. 11. Lee JY, Kim YY, Jung HR. Distribution and characteristics of peripheral anterior synechiae in primary angle-closure glaucoma. Korean J Ophthalmol. 2006;20(2):104-8. 12. Gadia R, Sihota R, Dada T, Gupta V. Current profile of secondary glaucomas. Indian J Ophthalmol. 2008;56(4):285-9. 13. Campbell DG. Pigmentary dispersion and glaucoma. A new theory. Arch Ophthalmol. 1979;97(9):1667-72. 14. Roberts DK, Ho LA, Beedle NL, et al. Heritage characteristics reported by a group of African-Americans who exhibit the pigment dispersion syndrome: a case-control study. Documenta Ophthalmologica. 2000;101(3):179-93. 15. Qing G, Wang N, Tang X, et al. Clinical characteristics of pigment dispersion syndrome in Chinese patients. Eye (Lond). 2009;23(8):1641-6. 16. Moroi SE, Lark KK, Sieving PA, et al. Long anterior zonules and pigment dispersion. Am J Ophthalmol. 2003;136(6):1176-8. 17. Scheie HG, Cameron JD. Pigment dispersion syndrome: a clinical study. Br J Ophthalmol. 1981;65(4):264-9. 18. Okafor K, Vinod K, Gedde SJ. Update on pigment dispersion syndrome and pigmentary glaucoma. Curr Opin Ophthalmol. 2017;28(2):154-60. 19. Richter CU, Richardson TM, Grant WM. Pigmentary dispersion syndrome and pigmentary glaucoma. A prospective study of the natural history. Arch Ophthalmol. 1986;104(2):211-5. 20. Migliazzo CV, Shaffer RN, Nykin R, Magee S. Long-term analysis of pigmentary dispersion syndrome and pigmentary glaucoma. Ophthalmology. 1986;93(12):1528-36. 21. Naumann GO, Schlötzer-Schrehardt U, Küchle M. Pseudoexfoliation syndrome for the comprehensive ophthalmologist. Intraocular and systemic manifestations. Ophthalmology. 1998;105(6):951-68. 22. Rao A, Padhy D. Pattern of pseudoexfoliation deposits on the lens and their clinical correlation--clinical study and review of literature. PLoS One. 2014;9(12):e113329. 23. Rasmussen CA, Kaufman PL. The trabecular meshwork in normal eyes and in exfoliation glaucoma. J Glaucoma. 2014;23(8 Suppl 1):S15-9. 24. Schlötzer-Schrehardt U, Naumann GO. A histopathologic study of zonular instability in pseudoexfoliation syndrome. Am J Ophthalmol. 1994;118(6):730-43. 25. Sangal N, Chen TC. Cataract surgery in pseudoexfoliation syndrome. Semin Ophthalmol. 2014;29(5-6):403-8. 26. Razeghinejad R, Lin MM, Lee D, Katz LJ, Myers JS. Pathophysiology and management of glaucoma and ocular hypertension related to trauma. Surv Ophthalmol. 2020;65(5):530-47. 27. Tumbocon JA, Latina MA. Angle recession glaucoma. Int Ophthalmol Clin. 2002;42(3):69-78. 28. Blanton FM. Anterior chamber angle recession and secondary glaucoma: a study of the aftereffects of traumatic hyphemas. Arch Ophthalmol. 1964;72:39-43. 29. Canavan YM, Archer DB. Anterior segment consequences of blunt ocular injury. Br J Ophthalmol. 1982;66(9):549-55. 30. Penn JS, Madan A, Caldwell RB, et al. Vascular endothelial growth factor in eye disease. Prog Retin Eye Res. 2008;27(4):331-71. 31. Rodrigues GB, Abe RY, Zangalli C, et al. Neovascular glaucoma: a review. Int J Retina Vitreous. 2016;2:26. 32. Siddique SS, Suelves AM, Baheti U, Foster CS. Glaucoma and uveitis. Surv Ophthalmol. 2013;58(1):1-10. 33. Mitchell P, Cumming RG, Mackey DA. Inhaled corticosteroids, family history and risk of glaucoma. Ophthalmology. 1999;106(12):2301-6. 34. Jonas JB, Budde WM. Diagnosis and pathogenesis of glaucomatous optic neuropathy: morphological aspects. Prog Retin Eye Res. 2000;19(1):1-40. 35. Damms T, Dannheim F. Sensitivity and specificity of optic disc parameters in chronic glaucoma. Invest Ophthalmol Vis Sci. 1993;34(7):2246-50. 36. Gundersen KG, Heijl A, Bengtsson B. Sensitivity and specificity of structural optic disc parameters in chronic glaucoma. Acta Ophthalmol Scand. 1996;74(2):120-5. 37. Sotelo-Monge KG, Espinosa-Barberi G, Pinilla Cortés LM, et al. Compressive optic neuropathy. Not everything that progresses is glaucoma. Arch Soc Esp Oftalmol (Engl Ed). 2021;96(4):219-23. 38. Yamamoto T. Superior segmental optic hypoplasia as a differential diagnosis of glaucoma. Taiwan J Ophthalmol. 2019;9(2):63-6. 39. Jonas JB, Fernández MC, Stürmer J. Pattern of glaucomatous neuroretinal rim loss. Ophthalmology. 1993;100(1):63-8. 40. Yang J, Qu Y, Zhao J, et al. Stereoscopic vs. monoscopic photographs on optic disc evaluation and glaucoma diagnosis among general ophthalmologists: a cloud-based real-world multicenter study. Front Med (Lausanne). 2022;9:990611. 41. Nakano E, Hata M, Oishi A, et al. Quantitative comparison of disc rim color in optic nerve atrophy of compressive optic neuropathy and glaucomatous optic neuropathy. Graefes Arch Clin Exp Ophthalmol. 2016;254(8):1609-16. 42. Kim YW, Yun YI, Choi HJ. Screening fundus photography predicts and reveals risk factors for glaucoma conversion in eyes with large optic disc cupping. Sci Rep. 2023;13(1):81. 43. Sutton GE, Motolko MA, Phelps CD. Baring of a circumlinear vessel in glaucoma. Arch Ophthalmol. 1983;101(5):739-44. 44. Garway-Heath DF, Ruben ST, Viswanathan A, Hitchings RA. Vertical cup-disc ratio in relation to optic disc size: its value in the assessment of the glaucoma suspect. Br J Ophthalmol. 1998;82(10):1118-24. 45. Thonginnetra O, Greenstein VC, Chu D, et al. Normal vs. high tension glaucoma: a comparison of functional and structural defects. J Glaucoma. 2010;19(3):151-7. 46. Rafla D, Khuu SK, Kashyap S, et al. Visualizing structural and functional characteristics distinguishing between newly diagnosed high-tension and low-tension glaucoma patients. Ophthalmic Physiol Opt. 2023;43(4):771-87. 47. Akagi T, Hangai M, Takayama K, et al. In vivo imaging of lamina cribrosa pores by adaptive optics scanning laser ophthalmoscopy. Invest Ophthalmol Vis Sci. 2012;53(7):4111-9. 48. Downs JC, Girkin CA. Lamina cribrosa in glaucoma. Curr Opin Ophthalmol. 2017;28(2):113-9. 49. Strickland RG, Garner MA, Gross AK, Girkin CA. Remodeling of the lamina cribrosa: mechanisms and potential therapeutic approaches for glaucoma. Int J Mol Sci. 2022;23(15):8068. 50. Jonas JB, Schiro D. Localized wedge-shaped defects of the retinal nerve fiber layer in glaucoma. Br J Ophthalmol. 1994;78(4):285-90. 51. Shin JW, Uhm KB, Seong M, Kim YJ. Diffuse retinal nerve fiber layer defects identification and quantification in thickness maps. Invest Ophthalmol Vis Sci. 2014;55(5):3208-18. 52. Odstrcilik J, Kolar R, Tornow R-P, et al. Thickness-related textural properties of retinal nerve fiber layer in color fundus images. Comput Med Imaging Graph. 2014;38(6):508-16. 53. Drance SM. Disc hemorrhages in the glaucomas. Surv Ophthalmol. 1989;33(5):331-7. 54. Siegner SW, Netland PA. Optic disc hemorrhages and progression of glaucoma. Ophthalmology. 1996;103(7):1014-24. 55. Budenz DL, Anderson DR, Feuer WJ, et al. Detection and prognostic significance of optic disc hemorrhages during the Ocular Hypertension Treatment Study. Ophthalmology. 2006;113(12):2137-43. 56. Jonas JB. Clinical implications of peripapillary atrophy in glaucoma. Curr Opin Ophthalmol. 2005;16(2):84-8. 57. Liu W, Gong L, Li Y, et al. Peripapillary Atrophy in High Myopia. Curr Eye Res. 2017;42(9):1308-12. 58. Rensch F, Jonas JB. Direct microperimetry of alpha zone and beta zone parapapillary atrophy. Br J Ophthalmol. 2008;92(12):1617-9. 59. Zhang Q, Wang YX, Wei WB, et al. Parapapillary beta zone and gamma zone in a healthy population: The Beijing Eye Study 2011. Invest Ophthalmol Vis Sci. 2018;59(8):3320-9. 60. Ahmad SS, Tanveer Y, Siddique M, Saleem Z. Controversies in the association of parapapillary atrophy with glaucoma. Taiwan J Ophthalmol. 2020;10(4):243-9. 61. Ly A, Phu J, Katalinic P, Kalloniatis M. An evidence-based approach to the routine use of optical coherence tomography. Clin Exp Optom. 2019;102(3):242-59. 62. Lee WJ, Oh S, Kim YK, et al. Comparison of glaucoma-diagnostic ability between wide-field swept-source OCT retinal nerve fiber layer maps and spectral-domain OCT. Eye (Lond). 2018;32(9):1483-92. 63. Jeoung JW, Park KH, Kim TW, Khwarg SI, Kim DM. Diagnostic ability of optical coherence tomography with a normative database to detect localized retinal nerve fiber layer defects. Ophthalmology. 2005;112(12):2157-63. 64. Bowd C, Zangwill LM, Weinreb RN, et al. Estimating optical coherence tomography structural measurement floors to improve detection of progression in advanced glaucoma. Am J Ophthalmol. 2017;175:37-44. 65. Moghimi S, Bowd C, Zangwill LM, et al. Measurement floors and dynamic ranges of oct and oct angiography in glaucoma. Ophthalmology. 2019;126(7):980-8. 66. Realini T, Zangwill LM, Flanagan JG, et al. Normative databases for imaging instrumentation. J Glaucoma. 2015;24(6):480-3. 67. Nakayama LF, Zago Ribeiro L, de Oliveira JAE, et al. Fairness and generalizability of OCT normative databases: a comparative analysis. Int J Retina Vitreous. 2023;9(1):48. 68.Mehta N, Waheed NK. Diversity in optical coherence tomography normative databases: moving beyond race. Int J Retina Vitreous. 2020;6(1):5. |