 |
The Definitive Guide to Corneal Topography
Understanding when and how to use this tool is a critical component of optometric practice.
By Becky Su, OD, Marcus Noyes, OD, and John Gelles, OD
Jointly provided by the Postgraduate Institute for Medicine (PIM) and the Review Education Group
Release Date: September 15, 2023
Expiration Date: September15, 2026
Estimated Time to Complete Activity: two hours
Target Audience: This activity is intended for optometrists interested in the tools necessary to monitor eye health and vision.
Educational Objectives: After completing this activity, participants should be better able to:
Recognize the role of corneal topography in optometric practice.
Effectively use this tool in contact lens management.
Employ corneal topography for the detection of corneal disease.
Correctly use corneal topography for pre- and postoperative management.
Disclosure of Conflicts of Interest: PIM requires faculty, planners and others in control of educational content to disclose all their financial relationships with ineligible companies. All identified conflicts of interest are thoroughly vetted and mitigated according to PIM policy. PIM is committed to providing its learners with high-quality, accredited CE activities and related materials that promote improvements or quality in health care and not a specific proprietary business interest of an ineligible company.
Those involved reported the following relevant financial relationships with ineligible entities related to the educational content of this CE activity: Faculty - Drs. Su, Noyes and Gelles have nothing to disclose. Planners and Editorial Staff - PIM has nothing to disclose. The Review Education Group has nothing to disclose.
Accreditation Statement: In support of improving patient care, this activity has been planned and implemented by PIM and the Review Education Group. PIM is jointly accredited by the Accreditation Council for Continuing Medical Education, the Accreditation Council for Pharmacy Education and the American Nurses Credentialing Center to provide CE for the healthcare team. PIM is accredited by COPE to provide CE to optometrists.
Credit Statement: This course is COPE-approved for two hours of CE credit. Activity #126680 and course ID 86588-GO. Check with your local state licensing board to see if this counts toward your CE requirement for relicensure.
Disclosure of Unlabeled Use: This educational activity may contain discussion of published and/or investigational uses of agents that are not indicated by the FDA. The planners of this activity do not recommend the use of any agent outside of the labeled indications. The opinions expressed in the educational activity are those of the faculty and do not necessarily represent the views of the planners. Refer to the official prescribing information for each product for discussion of approved indications, contraindications and warnings.
Disclaimer: Participants have an implied responsibility to use the newly acquired information to enhance patient outcomes and their own professional development. The information presented in this activity is not meant to serve as a guideline for patient management. Any procedures, medications or other courses of diagnosis or treatment discussed or suggested in this activity should not be used by clinicians without evaluation of their patient’s condition(s) and possible contraindications and/or dangers in use, review of any applicable manufacturer’s product information and comparison with recommendations of other authorities.
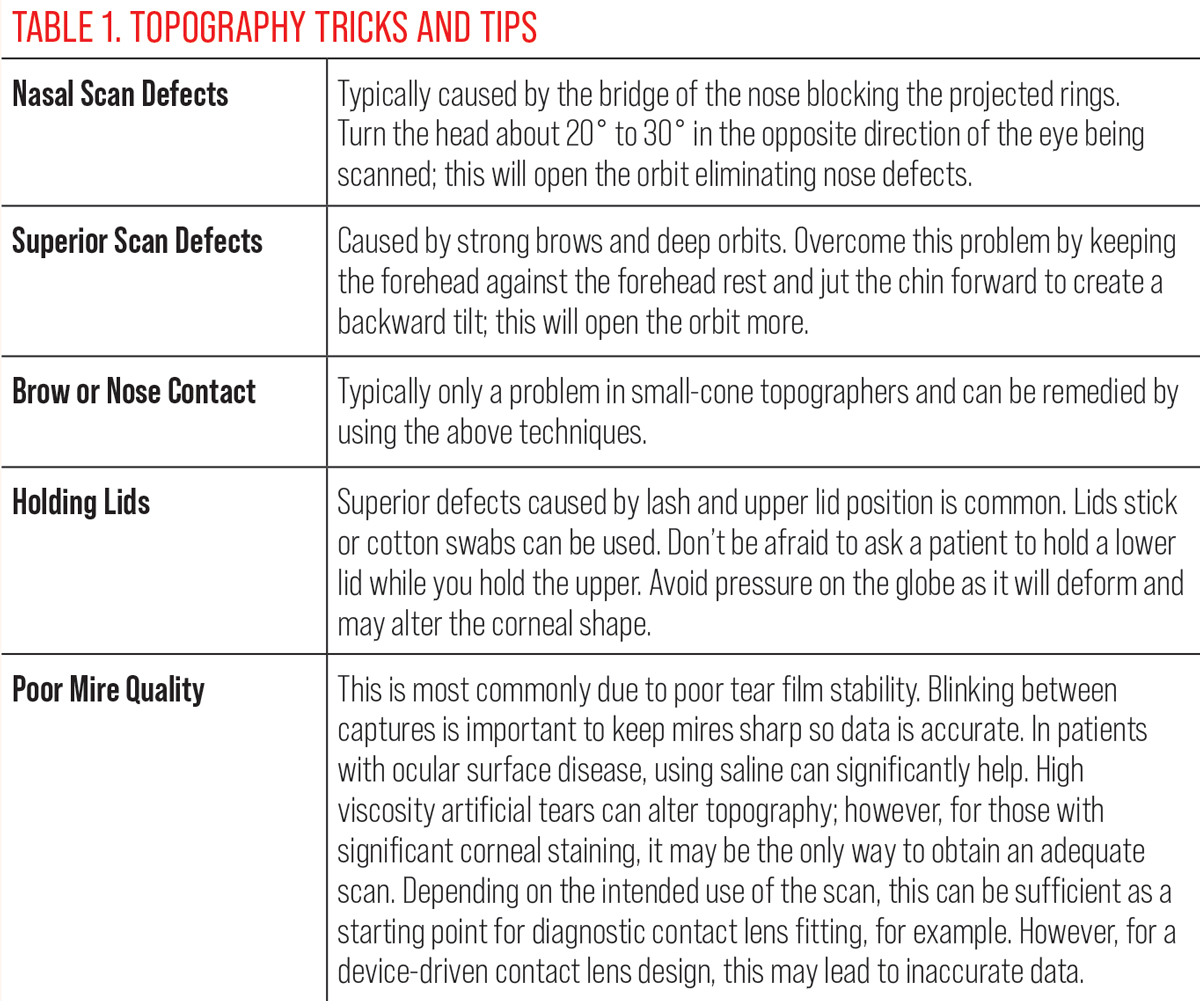 |
Click table to enlarge. |
As eyecare practitioners, we understand the crucial role diagnostic tools play in patient care. They allow us to make the invisible visible and quantifiable. Corneal topography is a vital instrument that offers valuable insights into the state of the corneal surface. Due to its applicability and benefits, corneal topography should be a ubiquitous tool used frequently in our daily practice to facilitate informed decisions about vision and eye health. This article tells you everything you need to know about how to succeed with corneal topography.
Understanding the Technology
Corneal topography visually represents the corneal surface curvature and provides quantitative and qualitative data. Over the years, it has evolved to include evaluations beyond typical curvature maps.
One of the earliest forms of corneal topography, and still the most commonly used today, is Placido disc-based systems. These systems rely on the reflection of a series of illuminated concentric rings projected onto the corneal surface and a centrally located camera to capture an image of the reflection. The cornea’s curvature is then calculated by analyzing the shape and spacing between the reflected mires. Widely spaced mires indicate a flatter corneal curvature and closely spaced rings indicate a steeper curvature. These systems heavily depend on the tear film to reflect the illuminated ring image.
Placido disc topographers can be categorized as either small-cone or large-cone systems. Small-cone topographers can achieve near-limbus-to-limbus scan coverage. Large-cone topographers capture images of the central 7mm to 8mm.
Ring spacing is another differentiating factor. Denser, more tightly spaced rings can capture more detailed curvature data, whereas wider-spaced rings tend to have fewer issues with ring overlap-related artifacts.
 |
|
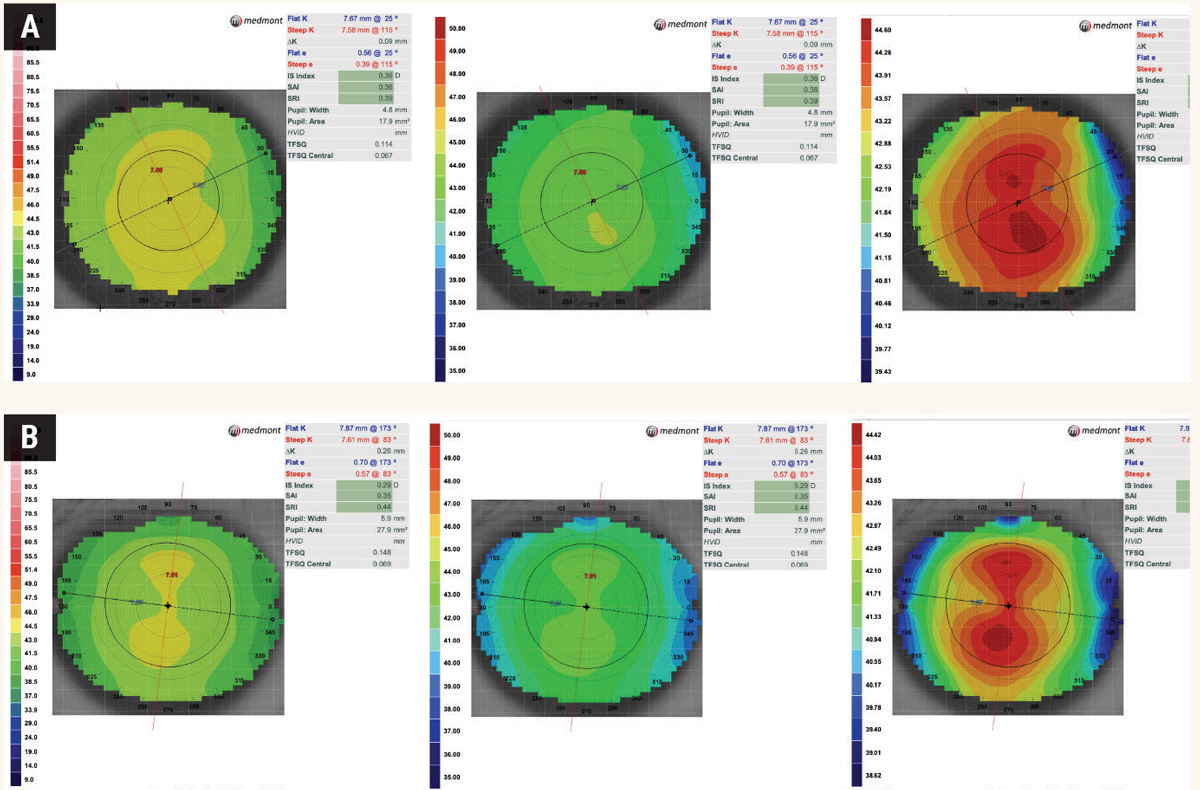
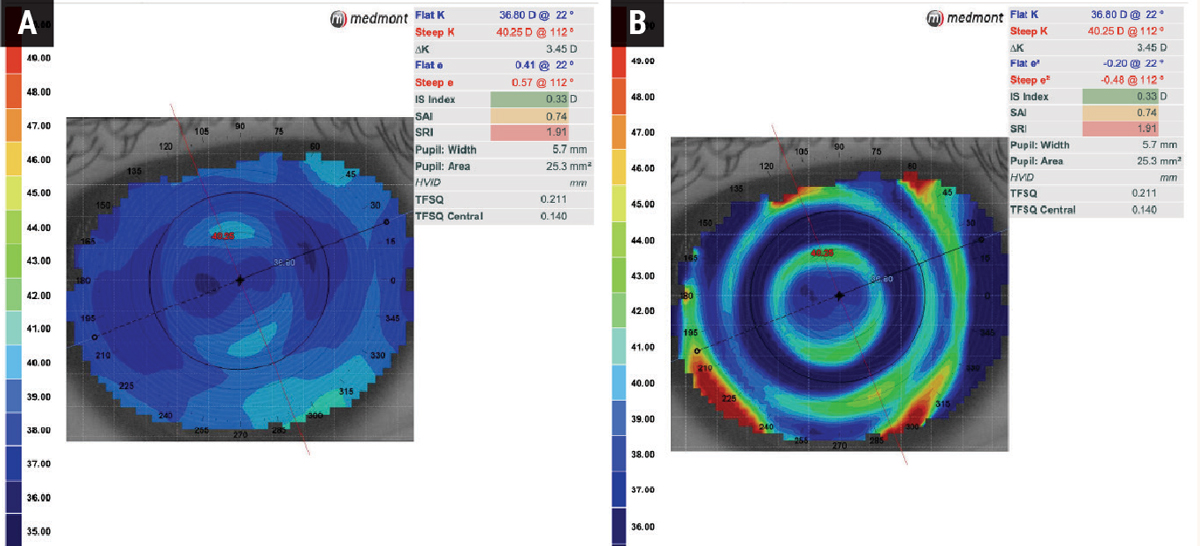
Fig. 1. Same axial map scan of (A) normal, spherical cornea and (B) regular astigmatic cornea with different scaling: The color scale represents the power in Diopters at each particular point. In (A), the K Scale and Standard Power color maps show a uniform green/yellow pattern compared to a Normalized Power scale, which shows a gradient with multiple colors and a large red area. At first glance, it may be easy to assume that the third topography map is irregular and steep due to the predominantly red presentation. However, the scale setting used maxes out at 44.60 diopters which correlates with the dark red color. In (B), the K scale shows a mild classic, with-the-rule topography pattern but appears spherical in the standard power. The astigmatic pattern is much more pronounced in the Normalized scaling. It is thus important to take note of the scaling range as it is much broader in the standard scale compared to the normalized scale. Click image to enlarge. |
Other reflection-based technologies for deriving corneal topography include raster stereography, in which raster grids are projected onto the ocular surface instead of concentric rings after applying sodium fluorescein. This technology is no longer available in the form of a corneal topographer; however, it has been successfully applied to corneoscleral profilometry to map the ocular surface, primarily for scleral shape analysis and device-driven scleral lens design.
Another technology uses a large series of multi-color LED lights in a dot grid pattern that capture the image as it is projected onto the cornea. Its software uses the spacing between the dots to derive the corneal surface and infrared LED lights to measure second Purkinje images, providing simplified information about the posterior cornea.
Differentiating the Maps
The data captured during corneal topography can be presented in different types of corneal maps, such as axial, tangential and elevation.
Axial (sagittal) maps. This is the classic standard representation on all topography devices. It shows the corneal power and shape at a glance, facilitating the diagnosis and monitoring of corneal conditions such as keratoconus. It also assesses corneal power changes caused by corneal treatments such as corneal refractive surgery or orthokeratology (ortho-K). In this map, the corneas’ curvature is calculated using the corneal apex as a reference point, and the data is averaged, creating a “smooth” map, thereby losing minute details of the peripheral cornea.
Tangential (instantaneous) maps. Unlike axial maps, tangential maps are more sensitive and do not use a single point as a reference. They enable a more precise depiction of local curvature changes, particularly in the peripheral cornea. These maps are ideal for measurements where fine detail is important, such as the assessment of ortho-K treatment, specifically treatment zone centration.
Elevation maps. These maps show the “height” or “elevation” of the cornea at any given point relative to a reference shape. A “best-fit sphere” is calculated and extrapolated through the cornea as a reference. The best-fit sphere on an elevation map may be centered on the corneal apex, shifted to the line of sight, tilted, in contact with, or floating through the measured corneal surface.
Some corneal topography devices allow other modifications to the best-fit shape, such as choosing sphere diameter or even selecting a non-spherical shape such as a torus. Deviation values from the best-fit sphere are measured and displayed in microns, allowing areas of relative elevation or depression to be identified.
 |
|
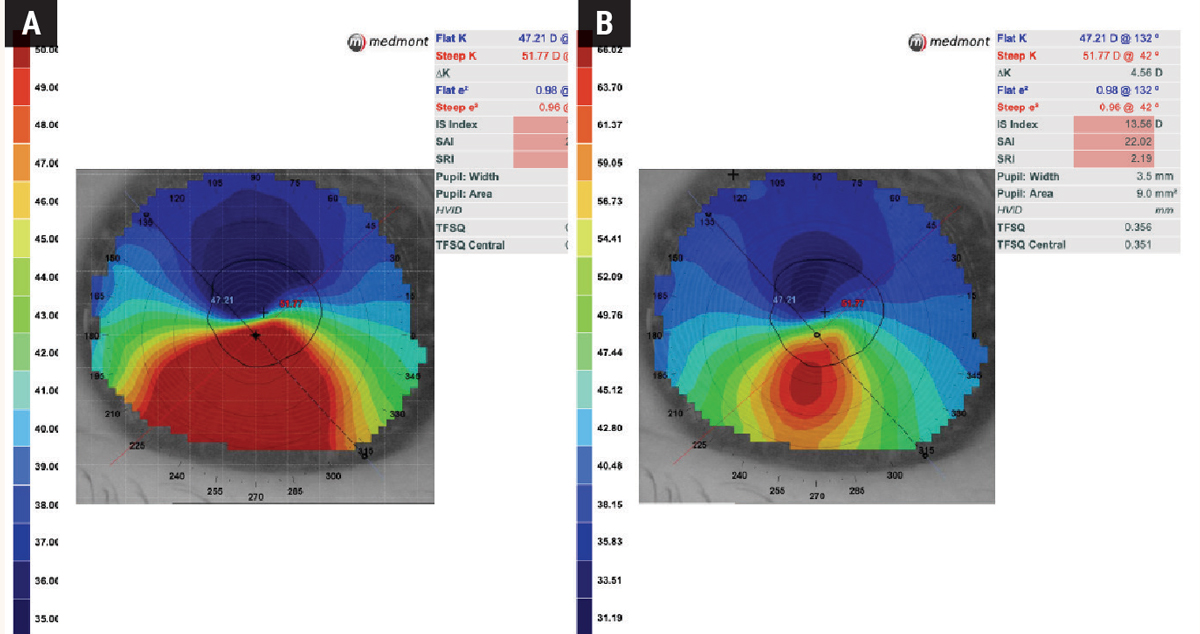
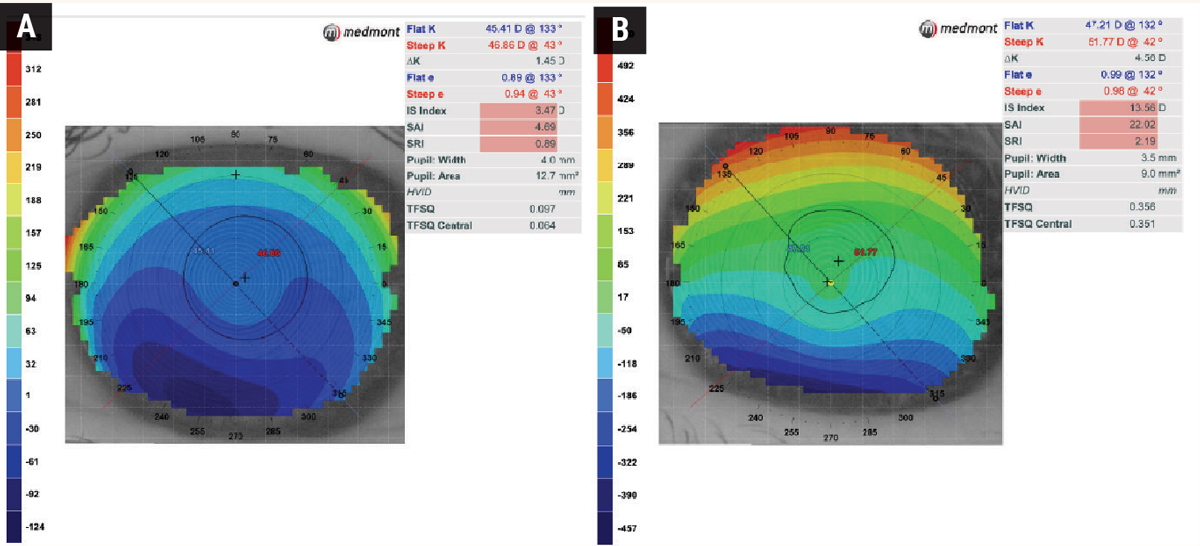
Fig. 2. Same axial map with different scaling in an irregular cornea: Initially using the default Standard Power scaling (A), it is apparent that the patient has keratoconus, but the scale only goes up to 50.00D, while the steep K-reading itself exceeds this value at 51.77D. Once the scale is adjusted to Normalized Power (B), the map reveals a steeper and more condensed cone compared with the Standard Power scale. Click image to enlarge. |
Importance of Scaling
Color scales in corneal topography represent different measurements (e.g., curvature, elevation, power). The color spectrum used varies by brand and model but generally ranges from cool to warm colors, each corresponding to a specific value range.
Warmer colors (orange/red) tend to indicate higher values, while cooler colors (indigo/blue) indicate lower ones. Values are selected from each map, such as diopters and mm of curvature for Axial and Tangential, and microns for Elevation. The maps are color-coded, and even customizable: “fine scaling” shows color changes in 0.5 D steps, whereas “rough scaling” can be ≥2.0 D per step.
The main scales are as follows:
• Absolute Scale: uses fixed color-coding that is the same for all patients and exams, allowing for consistent comparison between different exams or different patients.
• Normalized (Relative or Adaptive) Scale: matches color coding to a specific patient’s measurements, helping to highlight subtle differences in that patient’s cornea. However, this scale makes comparisons between patients, and even the same patient, at different time points more difficult.
• User-Defined Scale: some topographers allow users to define their color scale, thus customizing it to specific needs or preferences.
• Standardized Scale: recommended by organizations like the American National Standards Institute (ANSI) and commonly used for scientific research.
Pro tip: Normalized scales often overemphasize the blue/green or orange/red colors on the corneal topography, depending on the condition diagnosed. Failure to carefully review this information can lead to an incorrect diagnosis. Achieving an accurate representation relies on selecting the appropriate scale (Figures 1 and 2).
Evaluating Scan Quality
The corneal topography’s precision depends on image quality. High-quality scans have full coverage of the cornea (dependent on topographer cone size), are well-centered and have no missing or extrapolated data.
 |
|
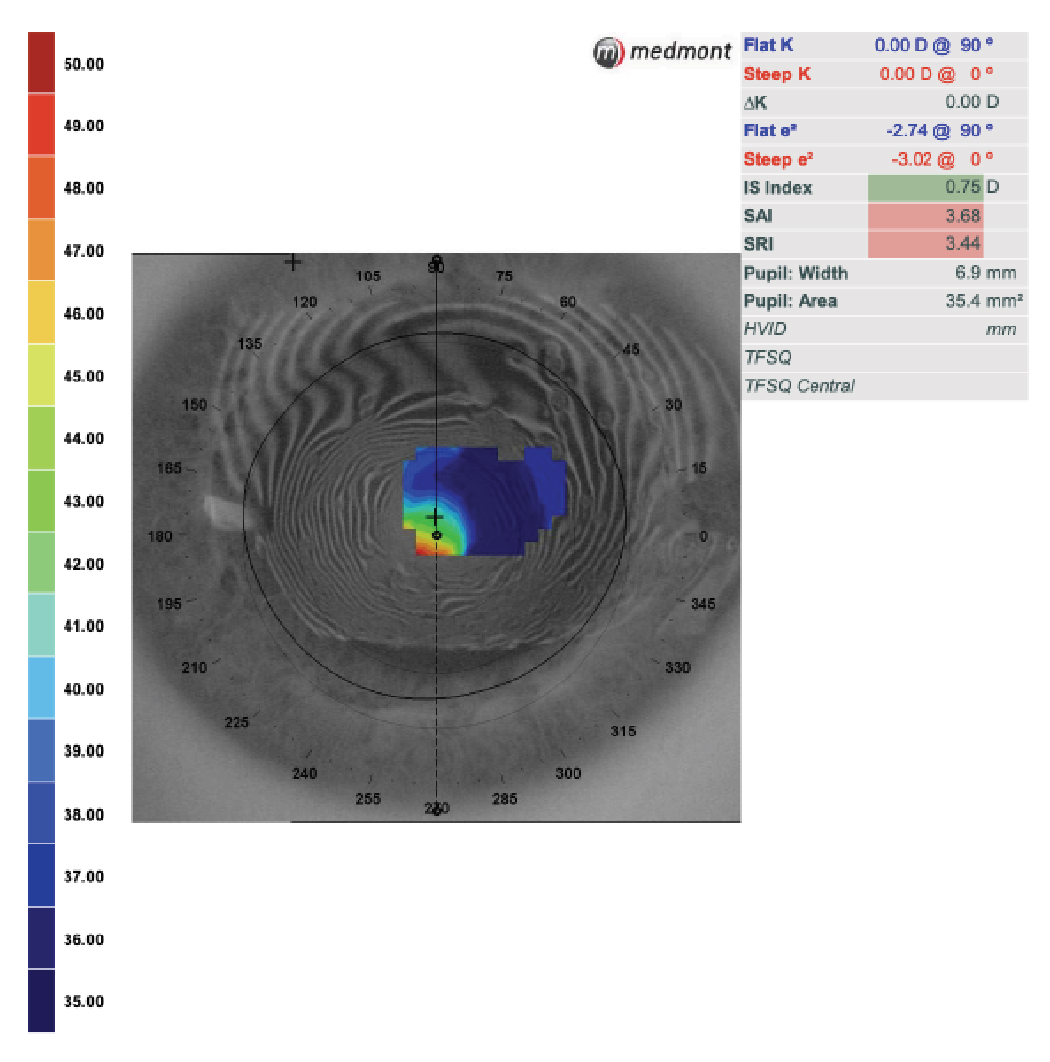
Fig. 3. Poor scan quality due to an unstable tear film. Irregularities of the mires and area with incomplete data collection do not allow a reliable diagnosis. Click image to enlarge. |
Artifacts such as eyelashes, reflections or tear film abnormalities can lead to inaccurate data interpretation. Poor fixation leading to decentered images, patient motion causing smearing of mires and incomplete data capture can also degrade scan quality. If the mires—particularly near the center—are distorted, the data is unreliable (Figure 3).
Furthermore, it is important to ensure the patient blinks sufficiently between scans to maintain the tear film, as a dry ocular surface can significantly impact the measurements. Although this tear film dependency may be the cause of variability, it allows for non-invasive measurement of tear film quality. Many topographers have quality score metrics, indicating errors due to acquisition, position, blinking, and fixation. However, severe corneal irregularities can deform the cornea so much that high-quality scans are no longer possible.
Corneal Topography in Contact Lens Management
Corneal topography is the cornerstone of contact lens management, particularly for fitting complex corneas and specialty contact lenses, but it is also valuable for any contact lens. Its maps help determine the appropriate lens design, base curve, diameter and power. Axial maps are ideal for base curve selection of a corneal GP, hybrid or soft contact lens as it portrays the average central curvature.
Contact lens optics can be evaluated using tangential map displays while the lens is on the eye, which is particularly useful for patients wearing a multifocal lens to assess the exact optics position in the line of sight. The display shows the lens power over the cornea, allowing the examiner to closely monitor the optics position to get a better clinical idea of optical performance (Figure 4). This map is also sensitive to changes in corneal curvature caused by contact lens warpage.
 |
|
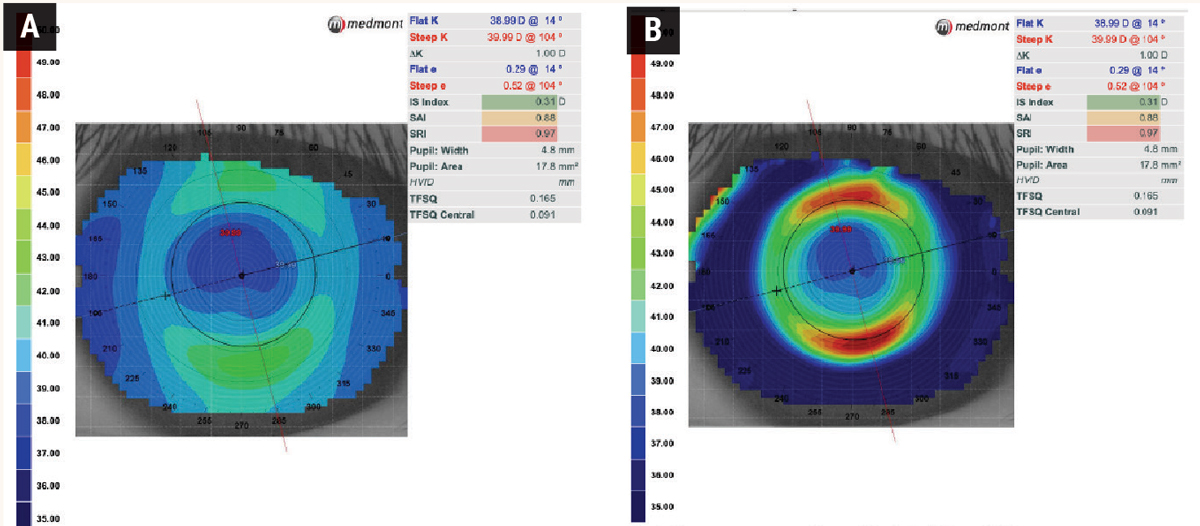
Fig. 4. Axial (A) and tangential (B) power maps of a patient wearing a multifocal soft lens for myopia control. The tangential map provides a detailed overview of the lens centration. Click image to enlarge. |
Comparative, difference or subtractive maps can be used to identify corneal effects and correlate complaints such as optical blurring after contact lens wear. Flattening of the corneal topography occurs in patients with hyperopic shifts after wearing a contact lens. With this data, the lens can be modified with a steeper base curve to reduce corneal deformation and the associated blurring of the glasses.
Additionally, tangential maps are beneficial in ortho-K, especially when evaluating the peripheral corneal shape (Figure 5). It also guides post-wear centration analysis. Difference maps can be used to compare a baseline scan to the treatment map and show accurate lens positioning (Figure 6). The lens’s position and fit are accurately displayed by resetting the scale proportionately to the amount of myopia corrected.
The elevation display map helps selecting the optimal ortho-K lens design. When there is an elevation difference of 30µm or greater at the 8mm chord between the principal meridians, it indicates that a toric lens is better suited for correct lens alignment and centering (Figure 7).1 It can also be used for an irregular cornea, especially when deciding between a corneal or scleral lens.
As corneal irregularities increase, the surface will likely become more asymmetrical, preventing symmetric lenses from conforming to the surface. Individuals with an elevation difference between the highest and lowest point of elevation greater than 350µm will likely need a scleral lens since the level of difference causes the corneal gas permeable (GP) lens to be unstable on the eye (Figure 8).2 In this way, corneal topography can guide lens selection. In this case, scleral lenses will be used to vault the cornea and achieve a successful fit.
 |
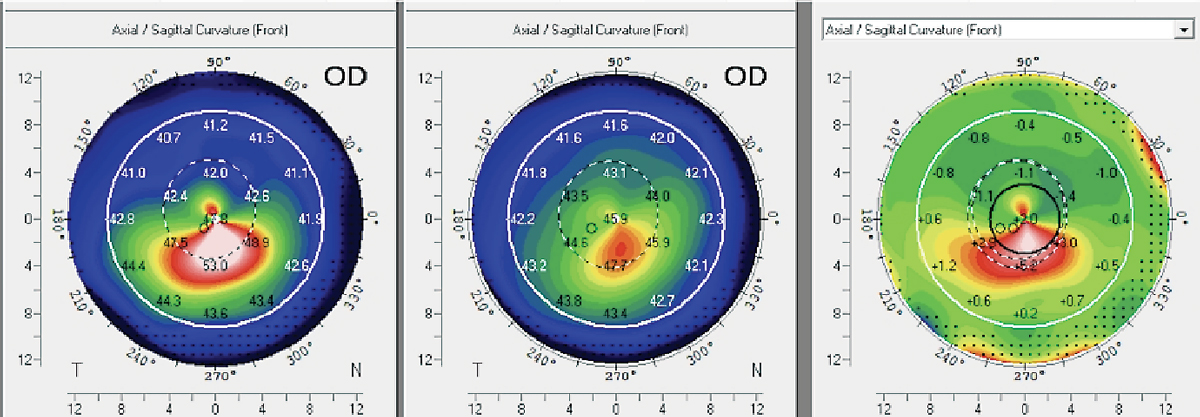
| Fig. 5. Axial power map (A) and tangential power map (B) of a patient treated with orthokeratology. The axial map provides data on the corneal astigmatism type and corneal curvature power. A tangential map allows the visualization of the corneal curvature in one place relative to neighboring tangential points. This is most helpful when analyzing orthokeratology lens centration. Click image to enlarge. |
Lens fitting software allows simulation of a contact lens on the ocular surface and to facilitate empirical lens orders. More advanced software can allow this surface data to be used to create freeform lenses incorporating the corneal shape.
Dry Eye Disease
Before initiating contact lens wear, the noninvasive tear break-up test, available on many Placido disc topographers, can assess tear film stability, a vital metric as successful contact lens wear relies on a healthy tear film.
When performing topography over the contact lens, the tear break-up display can determine the surface wettability of the lens. This display provides a quantitative score to monitor tear film stability while wearing contact lenses.
Detecting Corneal Disease
By capturing detailed measurements of the corneal surface, topography goes beyond traditional clinical examinations. Advanced imaging enables precise analysis of the cornea’s shape, curvature and regularity, allowing for early detection and diagnosis of various corneal diseases.
A quintessential example is keratoconus. Patient history may give warning signs, such as complaints of ghosting, frequent prescriptions changes, difficulty with contact lens wear, asymmetric vision, and glare, flare, streaks, halos, and vision that is worse at night, or they may suffer from diseases or conditions that put them at higher risk for developing keratoconus such as floppy eyelid syndrome, sleep apnea, or Down, Marfan or Ehlers-Danlos syndrome.
Other warning signs include patients who frequently rub their eyes and those with a family history of keratoconus.3,4
 |
|
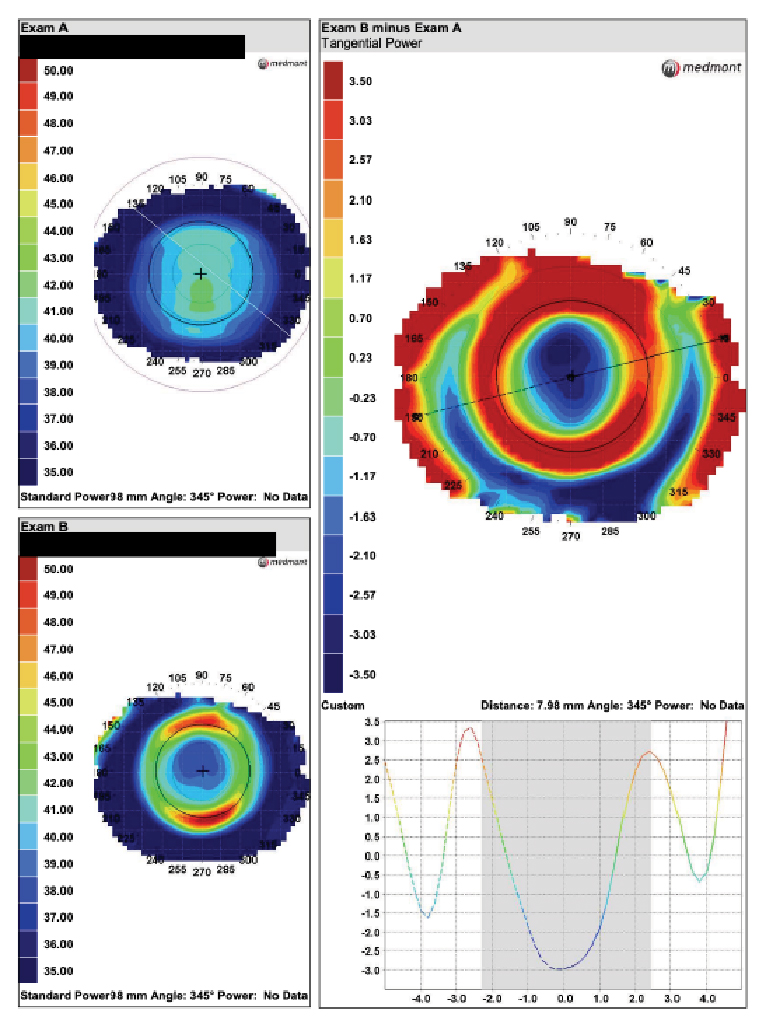
Fig. 6. Comparison of post and pre-wear topography scans to highlight changes in corneal shape caused by orthokeratology lenses. The scale was reset for this -3.50D myope’s tangential difference map. The lens is centered and there is -3.50D of treatment. Click image to enlarge. |
Clinically, several signs can help determine if topography is warranted. Autorefraction and autokeratometry may reveal high astigmatism and steep keratometry readings on an oblique or against-the-rule axis due to corneal irregularities. Retinoscopy may show a scissor reflex, and manifest refraction may be challenging with reduced visual acuity.
Slit lamp examination may appear normal, but in moderate to severe keratoconus, the presence of Vogt’s striae, Fleischer’s ring or Munson’s sign may be evident. When any of these clinical findings and medical history are present, topography is necessary to confirm the suspicion of disease.
Early Detection in Pediatric Patients
Keratoconus has been observed in children as young as age four and progresses significantly faster than in adults.5 Studies suggest that children with keratoconus have more severe disease at diagnosis, with 27.8% classified as stage 4 as opposed to 7.8% in adults.6 This may be attributed to the early onset, rapid progression and the challenges associated with conducting comprehensive eye exams in children.
Patients with early-stage keratoconus, particularly children, often exhibit anisometropia and a high degree of cylinder and asymmetric astigmatism. Given these factors and the information discussed above, corneal topography screening may be helpful in all pediatric patients.
Topography reveals the cornea’s shape, curvature and regularity, which aids in the early detection of subtle corneal irregularities and allows for timely intervention, thereby mitigating the impact of keratoconus on a child’s vision. For pediatric patients not correctable to 20/20, amblyopia cannot be diagnosed without corneal topography. Only in the absence of corneal pathology can amblyopia be confirmed.
Indices and Monitoring
Corneal topography has demonstrated remarkable sensitivity in detecting ectatic disease even before the loss of vision and significant slit-lamp exam findings manifest. While keratoconus is identified by the distinctive topographical pattern of inferior steepening, other signs may also raise suspicion.
Topography metrics for the diagnosis of keratoconus have been studied extensively. Much of the early work was performed by Rabinowitz and Klyce.7,8 Various indices, such as Rabinowitz and McDonnell’s inferior-superior asymmetry, are commonly used for keratoconus detection. Indicators raising suspicion of keratoconus include corneal curvature greater than 47.2D and greater than 1.4D asymmetry between the 3mm radius values of the superior and inferior corneal regions.7,9
 |
|
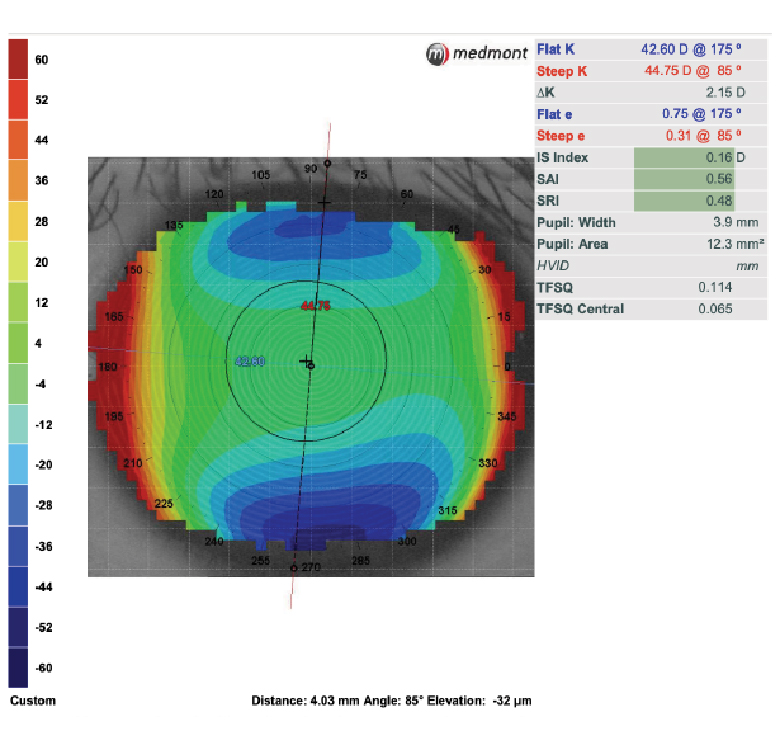
Fig. 7. In this case, the patient exhibits a limbus-to-limbus astigmatic pattern with a corneal cylinder exceeding 2.00D and an average elevation difference greater than 30µm between the steep and flat meridians. These findings indicate that a toric ortho-K lens design would yield a more favorable outcome for this patient. Click image to enlarge. |
Close monitoring of these parameters at regular follow-up visits every one to three months is critical in pediatric patients, as rapid disease progression may occur in this age group. Early detection of keratoconus allows for timely treatments, such as corneal collagen crosslinking (CXL), halting the disease progression. CXL is currently FDA-approved for patients with unstable keratoconus.
Regular topographic monitoring in keratoconus patients and post-CXL follow-up visits is essential for several reasons. It helps identify signs of disease progression that may require additional interventions to prevent further vision deterioration. It also aids in assessing the effectiveness of interventions such as CXL by providing objective measurements of corneal changes. Additionally, it helps optimize visual outcomes by guiding the selection of appropriate corrective measures, such as contact lenses or refractive surgeries, based on the evolving corneal topographic patterns.
In the long-term management of keratoconus, topography allows for precise monitoring of disease progression, assessment of treatment outcomes and timely implementation of appropriate interventions (Figure 9).
Pre- and Post-op Management of Refractive and Cataract Surgery
Preoperatively, corneal topography helps identify patients with subtle irregular astigmatism who may be at higher risk of postoperative complications. Used this way, clinicians can determine if a patient is not a suitable candidate for corneal refractive surgery.
It is important to note that though topography can provide information about the anterior cornea, it is inadequate for determining the candidacy for or planning of a cornea refractive procedure. In this way, topography is only used to screen out obvious non-candidates. Corneal tomography is considered the standard of care for refractive surgery evaluation, and the differences will be explained in the next section.
Topography also detects ocular surface irregularities due to dry eye or epithelial basement membrane disease, indicating that the surface may need to be normalized or optimized to obtain the best vision post-surgery.
 |
|
Fig. 8. Elevation maps of two corneas with keratoconus: (A) shows an elevation difference of ~150µm from the highest to lowest elevation point vs. (B) an elevation difference of over 600µm. This suggests that a GP is much more likely to be successful in (A), whereas a scleral lens is more likely to be successful in (B). Click image to enlarge. |
Postoperatively, corneal topography can assess a procedure’s success by comparing pre- and post-operative maps, which show changes in corneal shape, regularity and astigmatism. Additionally, it supports the diagnosis of possible complications such as post-operative ectasia or decentered ablation after refractive surgery.
Advances in Corneal Assessment and Combo Devices
The first commercial topographer was introduced over 30 years ago, and its value has stood the test of time. Combined with other technologies, its capabilities expanded, resulting in more powerful diagnostic devices. The following technologies are frequently combined with topography.
Color imaging with variable color illumination expands the possibilities for anterior segment photography where diffuse white light illumination can serve general purposes. Cobalt blue helps assess sodium fluorescence and infrared illumination captures images of the meibomian glands. This may include video modes, and with sophisticated software, there are objective metrics to quantify bulbar injection, pupil size, tear meniscus height and more.
Another popular combined device is a wavefront aberrometer, which measures the objective optics of the total eye. When combined with topography, the source of aberration can be located by differentiating the corneal surface from the internal eye. Another increasingly relevant combination is optical biometry. The growing adoption of myopia management has made measuring axial length a necessity and many of the treatments, soft lenses and ortho-K require corneal topography to be successful.
The next evolution of corneal evaluation provides more comprehensive metrics. Corneal tomography, emphasis on the “M,” is the new gold standard for corneal evaluation, with device availability for over 20 years. It was predominantly adopted by corneal and refractive surgeons but is commonly used today due to its utility.
 |
| Fig. 9. Scheimpflug-based imaging system to generate an axial map of a 14-year-old female patient who underwent CXL in her right eye. Following a 10-month post-CXL evaluation, the difference map reveals a significant increase of 5D in Kmax, indicating corneal steepening and progression. Consequently, the patient underwent a subsequent round of CXL treatment to enhance corneal stability. Click image to enlarge. |
Corneal topography measures only the anterior surface of the cornea, while tomography systems enable measurement of anterior, posterior and global corneal thickness. Various technologies are used to capture corneal tomography. Scheimpflug imaging involves a rotating Scheimpflug camera that captures cross-sectional images of the cornea. By analyzing these images, Scheimpflug imaging provides a three-dimensional evaluation of the corneal surfaces, both anterior and posterior, enabling precise measurements of curvature, elevation, and global pachymetry distribution.
Combined with sophisticated multi-metric analysis software and normative databases, exceptionally sensitive and specific analyses can be performed for refractive surgery screening or keratoconus progression analysis.
Initially developed for retinal imaging, optical coherence tomography (OCT) technology has been adapted for corneal evaluation. By employing low-coherence interferometry, OCT provides high-resolution cross-sectional images of the cornea, allowing visualization of the corneal layers and precise measurement of their thickness.
An underused technology, high-resolution ultrasound, has the advantage of deep tissue penetration facilitating assessment of the posterior sulcus, helpful in refractive surgery planning for phakic IOL implantations such as the Evo ICL. These advanced imaging techniques have greatly improved our understanding of corneal pathologies and our ability to assess corneal and refractive surgery.
Corneal tomography systems provide much more comprehensive corneal analysis. However, cost is a significant barrier to adoption. While they offer significantly more, making a comparison of the two systems inappropriate, they tend to be more expensive than their Placido ring-based counterparts.
That said, multiple systems are combined with Placido-based corneal topographers to provide even more data that cannot be obtained with tomography alone, such as mire imaging and tear film analysis. Topography is still and may always be relevant as it is inexpensive, extremely useful and easy to apply, making it a must have for every clinic.
Takeaways
Corneal topography provides a wealth of information about the anterior cornea and tear film. With a clear understanding of its capabilities and limitations, clinicians can use corneal topography to guide them in providing superior patient care. Since its introduction nearly 30 years ago, prices have become so affordable that every doctor should have access to this technology and, more importantly, use it frequently.
Dr. Su is the cornea and contact lens fellow at the Cornea and Laser Eye Institute (CLEI) Center for Keratoconus in Teaneck, NJ.
Dr. Noyes is a clinical assistant professor at the University of Iowa department of ophthalmology, specialty contact lens department in Iowa City, IA. He graduated from University of Houston College of Optometry and went on to complete a dual residency in cornea/contact lens and ocular disease at Havener Eye Institute, department of ophthalmology and visual science at The Ohio State University Wexner Medical Center. As part of the faculty at College Carver of Medicine at the University of Iowa, he is involved in teaching ophthalmology residents and medical students ophthalmological skills in both a lecture-based and clinical-based setting. He is a fellow of the American Academy of Optometry as well as the Scleral Lens Society.
Dr. Gelles is the director of the specialty contact lens division at the CLEI and the CLEI Center for Keratoconus. He is an assistant clinical professor at Rutgers New Jersey Medical School within the department of ophthalmology and visual science. He is an adjunct clinical professor at the State University of New York College of Optometry, Illinois College of Optometry and New England College of Optometry. They have no financial disclosures.
1. Kojima R, Caroline P, et al. Should all orthokeratology lenses be toric? Poster presented at the 2016 GSLS, Jan. 2016, Las Vegas. 2. Zheng F, Caroline P, Kojima R, et al. Corneal elevation differences and the initial selection of corneal and scleral contact lens. Poster presented at the 2015 Global Specialty Lens Symposium, January 2015, Las Vegas. 3. Woodward MA, Blachley TS, Stein JD. The association between sociodemographic factors, common systemic diseases, and keratoconus: an analysis of a nationwide heath care claims database. Ophthalmology. 2016;123(3):457-65. 4. Merdler I, Hassidim A, Sorkin N, et al. Keratoconus and allergic diseases among Israeli adolescents between 2005 and 2013. Cornea. 2015;34(5):525-9. 5. Mukhtar S, Ambati BK. Pediatric keratoconus: a review of the literature. Int Ophthalmol. 2018;38(5):2257-66. 6. Léoni-Mesplié S, Mortemousque B, Touboul D, et al. Scalability and severity of keratoconus in Children. Am J Ophthalmol. 2012:154(1)56-62.e1. 7. Rabinowitz YS, McDonnell PJ. Computer-assisted corneal topography in keratoconus. Refract Corneal Surg. 1989;5(6):400-8. 8. Wilson SE, Klyce SD. Advances in the analysis of corneal topography. Surv Ophthalmol. 1991;35(4):269-77. 9. Maeda N, Klyce SD, Smolek MK. Comparison of methods for detecting keratoconus using videokeratography. Arch Ophthalmol. 1995;113(7):870-4. |